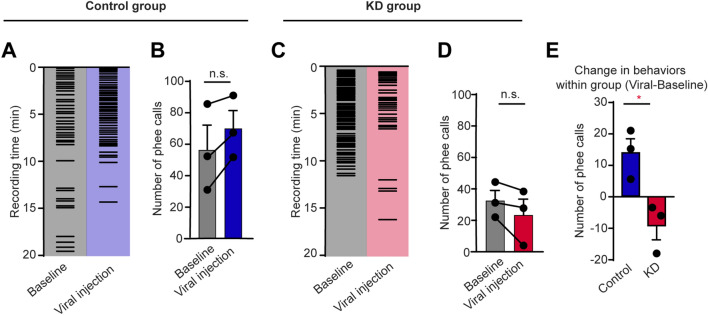
Fig. 4.
Decreased social desire for vocal communication in CB1R KD marmosets. A, C Example raster plots of phee calls during vocal recordings before and after virus injection in a control (A) and a KD (C) marmosets. B, D Five-day average number of phee calls before and after virus injection in control (B) and KD (D) groups. n = 3, two-tailed paired t-test, t(2) = 3.058, P = 0.0923 (B); t(2) = 0.1793, P = 2.031 (D). E Comparison of changes in phee calls between control and KD groups. n = 3 marmosets per group, two-tailed unpaired t-test, t(4) = 3.598, P = 0.0228. *P < 0.05; data are the mean ± SEM.

