Fig. 2.
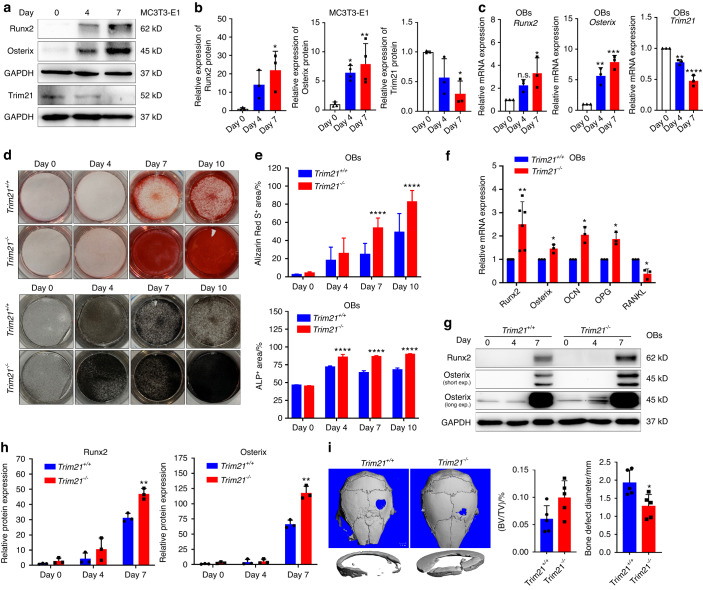
Loss of Trim21 enhances osteoblast activity and favors bone formation. a, b Representative immunoblotting analysis (a) and quantification of Runx2, Osterix, and Trim21 in MC3T3-E1 cells (b) treated with osteogenic medium for 0, 4, and 7 days. c Quantitative RT‒PCR analysis of osteogenic biomarker genes (Osterix, Runx2, and Trim21) in OBs with osteogenic induction. d, e Alizarin Red S (upper panel) and ALP (lower panel) staining of primary osteoblasts (OBs) after induction with osteogenic medium for different times (d). The percentage of Alizarin Red S- (n ≥ 3) and ALP- (n ≥ 3) stained area (e). f Quantitative RT‒PCR detection of osteogenic biomarker genes (Runx2, Osterix, OCN, OPG, and RANKL) in OBs derived from Trim21−/− and Trim21+/+ mice upon osteogenic induction for 7 days. g, h Representative immunoblotting analysis (g) and quantification of Runx2 and Osterix in OBs (h) after osteogenic induction for 0, 4, and 7 days. i Representative micro-CT images of calvarial bone defects in 2-month-old Trim21+/+ and Trim21−/− mice after surgical induction for 1 month (left panel). Quantitative measurements of bone volume per tissue volume (BV/TV) and bone defect diameter (right panel). All bar graphs are presented as the mean ± SD. *P < 0.05; **P < 0.01; ***P < 0.001; ****P < 0.000 1; n.s. not significant by Student’s t test

