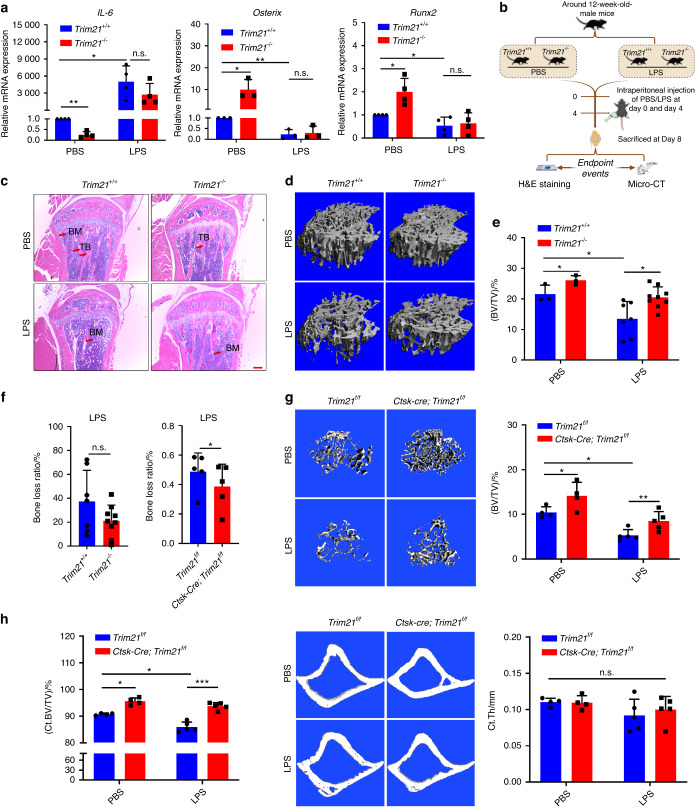
Fig. 5.
Loss of Trim21 protects mice from lipopolysaccharide (LPS)-induced bone loss. a Quantitative RT‒PCR determination of IL-6, Osterix, and Runx2 mRNA expression in OBs with or without lipopolysaccharide (LPS) treatment during osteogenic induction. b Schematic diagram showing the H&E staining and micro-CT analysis of Trim21+/+ and Trim21−/− mice induced by PBS or LPS. c Representative images of H&E staining of tibia sections of 13-week-old Trim21+/+ and Trim21−/− mice induced by PBS or LPS. Bone marrow (BM) and trabecular bone (TB) are labeled with red arrows. d, e Representative micro-CT images (d) and BV/TV (e) of proximal tibia trabecular bone of 13-week-old Trim21+/+ and Trim21−/− mice induced by PBS or LPS. f The bone loss ratio after LPS treatment in global knockout mice (left panel) and conditional knockout mice (right panel). g Representative micro-CT images and BV/TV of proximal tibia trabecular bone of 13-week-old Trim21f/f and Ctsk-cre; Trim21f/f mice induced by PBS or LPS. h Representative micro-CT images of cortical bones and quantification of BV/TV (left panel) and thickness (right panel) of Trim21f/f and Ctsk-cre; Trim21f/f mice induced by either PBS or LPS. All bar graphs are presented as the mean ± SD. *P < 0.05; **P < 0.01; ***P < 0.001; n.s. not significant by Student’s t test

