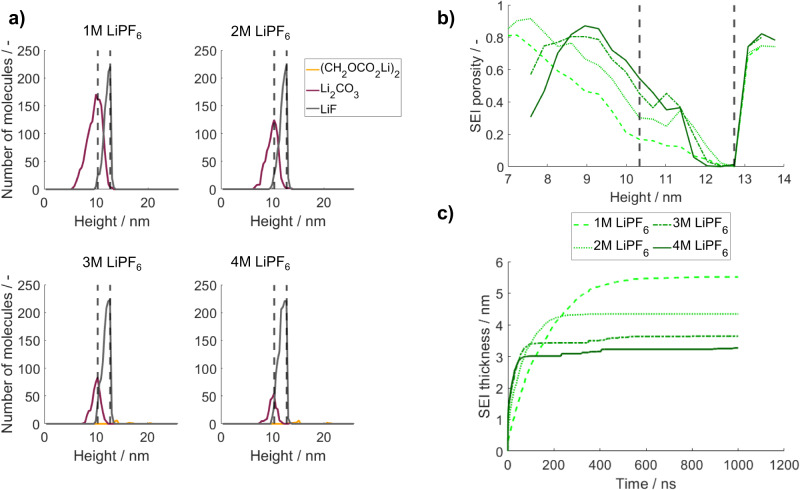
Fig. 6. Variation of the salt concentration between 1 M and 4 M LiPF6 in 100 wt% EC as solvent.
a Number of SEI molecules after a simulated contact time of Li with the electrolyte of 1 µs over height. The dashed lines represent the initial lithium metal surface (left) and the maximum electron transport distance (right). b SEI porosity after 1 µs over height for the investigated salt concentrations. c SEI thickness evolution for the investigated salt concentrations within 1 µs. Source data are provided as a Source Data file.

