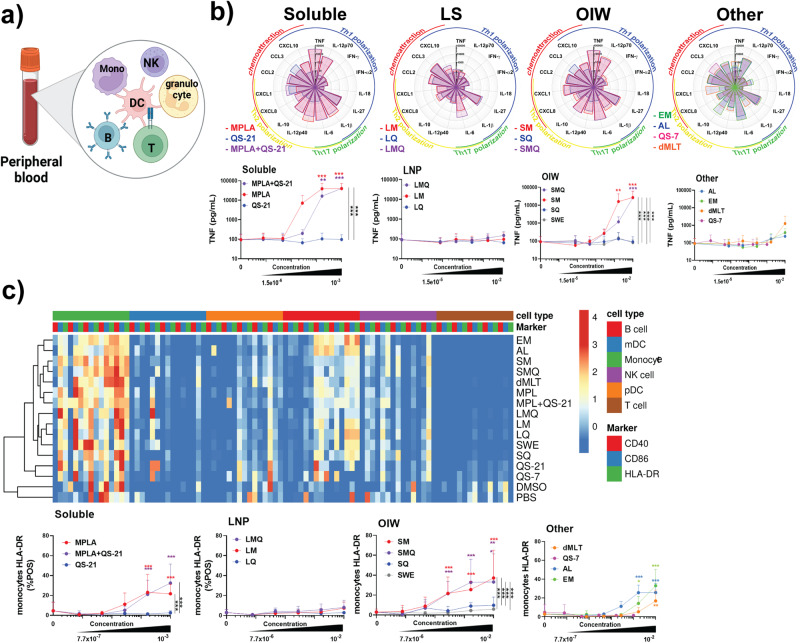
Fig. 1. MPL-containing compounds potently induce innate immune response in whole blood assay.
a Schematic representation of the Whole Blood Assay (WBA). b Flower plots show expression levels of 21 cytokines in pg/mL induced by treatment of whole blood with adjuvants at a 1:100 dilution for LNP, OIW, and Other, and 1:1000 dilution for Soluble formulations. Dose-response curves (mean + SD) indicate TNF production across a five-point dilution series, along with a vehicle control. Top concentrations reflect least diluted, as above. Further dilutions were 1/6 (v/v) in RPMI for all formulations. c Heat map indicating log10 MFI of activation markers across cell types. Dose-response curves measuring percentage of HLA-DR+ monocytes. Stars above a data point on dose-response curves indicate statistical significance relative to vehicle control using a two-way repeated measures ANOVA and Dunnet’s method for multiple comparison testing. Stars adjacent to vertical bars on dose-response curves (mean + SD) indicate statistically significant differences between treatment groups at a given concentration using a two-way repeated measures ANOVA with Tukey’s multiple comparison testing. N = 5 for all readouts, except CXCL8 where N = 2. (*p < 0.05, **p < 0.01, ***p < 0.001).

