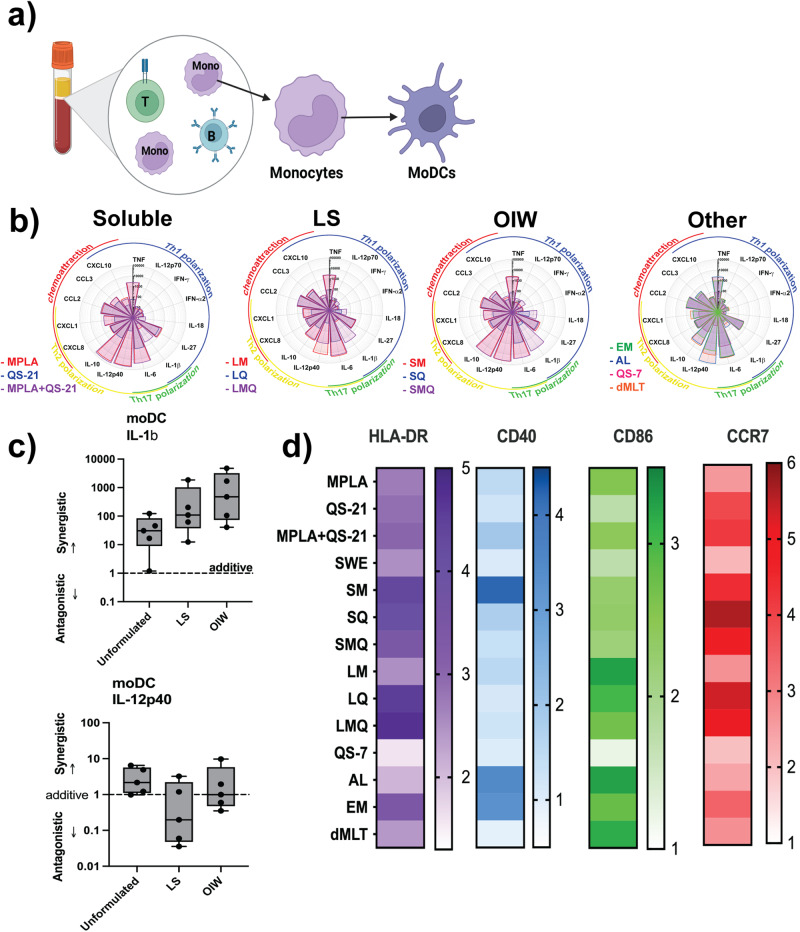
Fig. 3. LS-based MPL, QS21 or combination formulations activate MoDCs to produce a Th1-polarizing cytokine response in monocyte-derived dendritic cell (MoDC) assay.
MoDCs were stimulated with adjuvants at a 1:100 dilution for LNP, OIW, and Other, and 1:1000 dilution for Soluble formulations, before flow cytometric analysis of treatment-induced migrated cells and quantification of treatment-induced cytokine secretion. a Schematic representation of the monocyte-derived dendritic cell (MoDC) assasy. b Flower plots depict expression levels of 21 cytokines in pg/mL induced by treatment with adjuvants at their top concentrations. Dose-response curves show IL-1β production across a five-point dilution series (1/6 (v/v) each dilution, for all formulations) alongside a vehicle control. c Calculated D-values quantify the extent of synergy between MPL and QS-21 in each formulation type. D-values > 1 indicate antagonism, <1 indicate synergy, and =1 indicate additivity. (Box-whisker plots: centre line: median; bounds: 25th/75th percentile; whiskers; lowest/highest point). d Surface expression of four activation markers based on log10 MFI. Stars above a data point on flower plots and dose-response curves indicate statistical significance relative to vehicle control using a two-way repeated measures ANOVA and Dunnet’s method for multiple comparison testing. N = 5 for all assays. (*p < 0.05, **p < 0.01, ***p < 0.001).

