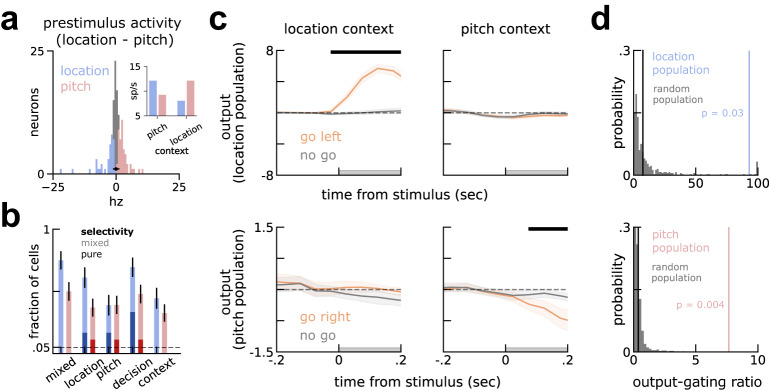
Fig. 3. Pre-stimulus context-dependent activity reveals three distinct populations in A1, as predicted by the model.
a Neurons are grouped in three populations (location in blue, pitch in red and population 0 in gray), based on their pre-stimulus firing rate modulation to context. In black, the mean (circle) and [2.5, 97.5] percentiles (bar) of firing rate modulation to context of shuffled trials within neurons. Inset, absolute values of prestimulus activity of location and pitch populations in either context. b Neurons in the pitch (n = 36) and location (n = 48) population (light blue and red bars, respectively) are mixed selective (Single-neuron selectivity in Methods), although a small fraction showed pure selectivity to some of the task variables (darker colors). Error-bars are standard errors of the mean. c Projection of stimulus responses of go left / right (orange) and no go (gray) onto the output axis for the location population (top) and pitch population (bottom). Different populations select the relevant go stimuli in different contexts. Left, projections of trials recorded during the location context. Right, equivalently for the pitch context. See Fig. S3 for the projections of individual stimuli, here grouped as go left/right and no go and Slight asymmetry between contexts in Supplementary Notes. d Permutation test shows output gating in (c) is not visible in randomly picked populations (gray, Methods). Top, location-population has an output gating ratio (blue vertical bar) higher than chance (p = 0.03). Bottom, pitch-population has gain modulation higher than chance (p = 0.004). Population 0 (black vertical bar in both plots) did not show above chance gain modulation (p > 0.25). All error-bars are bootstrapped standard errors of the mean60.

