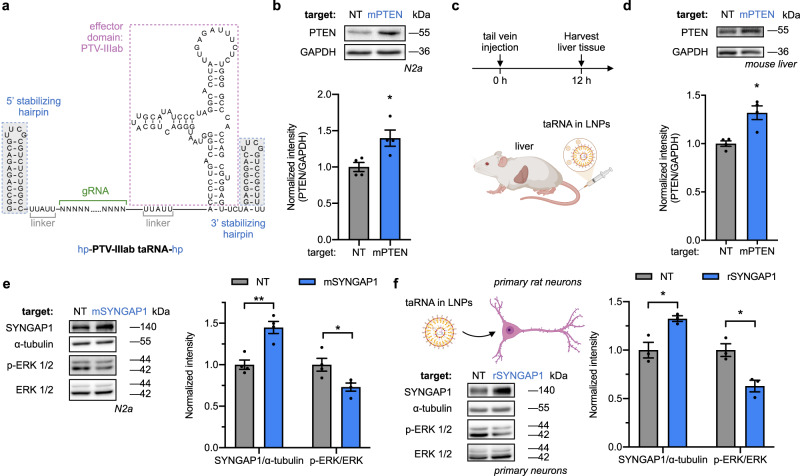
Fig. 4. LNP delivery of taRNAs in vitro and in vivo.
a Nucleotide sequence and secondary structure of the PTV-IIIab-based taRNA with stabilizing hairpins added at both 5′ and 3′ ends. All taRNAs in this figure utilized this stabilized form with PTV-IIIab as their effector domain, and were in vitro transcribed and delivered by LNPs. b Non-targeting (NT) or mouse PTEN (mPTEN)-targeting taRNA (500 ng) was delivered to N2a cells. After 12 h, the cells were lysed and PTEN protein levels measured via western blot. n = 4 biological replicates. c, d LNPs containing PTEN-targeting taRNAs or non-targeting taRNAs were injected into the tail vein of mice (c) and liver tissues were collected 12 h later. Hepatic PTEN protein levels were quantified via western blot (d). n = 4 biological replicates. LNP-packaged taRNAs targeting SYNGAP1 or non-targeting control (NT) were delivered to N2a cells (e) or rat primary neurons (f). Levels of SYNGAP1 protein and phosphorylated ERK1/2 (p-ERK1/2) were evaluated at 12 h post delivery. α-tubulin and total ERK1/2 were used for normalization as indicated. n = 4 biological replicates for (e), and n = 3 biological replicates for (f). All bar-graph values are shown as mean ± SEM with data points. Unpaired two-tailed Student’s t tests were performed between each group and its NT control. *P < 0.05, **P < 0.01. The P value and source data are provided as a Source Data file. Some elements created with BioRender.com.

