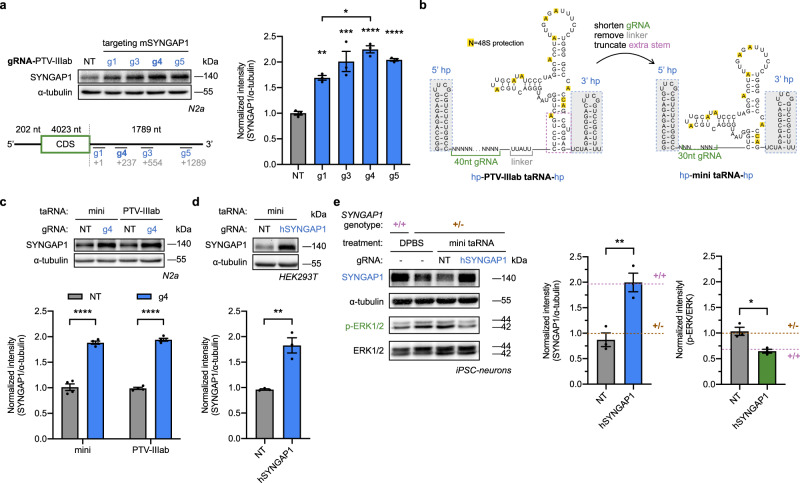
Fig. 5. Optimized mini taRNA rescues SYNGAP1 expression in haploinsufficiency-disease cells.
a PTV-IIIab-based taRNAs with various mouse SYNGAP1-targeting gRNAs (g1, g3, g4 and g5) were transfected into N2a cells as plasmids. The SYNGAP1 protein levels were measured by western blotting. The gRNAs are labeled with the number of nucleotides between stop codon and their landing sites (gray). The lengths of 5′ UTR, CDS and 3′ UTR of SYNGAP1 mRNA are labeled. n = 3 biological replicates. b Schematic illustrating the engineering of the PTV-IIIab-based taRNA to a minimized taRNA (mini taRNA). The detachable stabilizing hairpins on both ends (5′ hp and 3′ hp) are shadowed in gray. Nucleotides with yellow background were known to be protected upon 48S complex binding48. c mini- or PTV-IIIab-based taRNAs with NT or g4 were transfected into N2a cells as plasmids, and mouse SYNGAP1 upregulation levels were compared. g4 is the optimized guide RNA from (a). n = 4 biological replicates. d mini taRNA with NT or human SYNGAP1-targeting gRNA (hSYNGAP1) was transfected to HEK293T cells. n = 4 biological replicates. e Expression and functional rescue of SYNGAP1 in iPSC-derived SYNGAP1+/− neurons. The hSYNGAP1-targeting mini taRNA and NT control were in vitro transcribed and delivered by LNPs to iPSC-neurons. At 12-h post delivery, the levels of SYNGAP1 and phosphorylated ERK1/2 were assessed by western blots. Matched iPSC-neurons from heterozygous mutant (+/−, purple) or homozygous normal (+/+, brown) individuals treated with DPBS were used as reference level (dashed lines). n = 3 biological replicates. For western blots, α-tubulin and total ERK1/2 were used as loading controls. Representative blots were shown, and quantifications were normalized to non-targeting control (NT). All bar-graphs are shown as mean ± SEM with data points. Statistical analyses were performed using (a) one-way ANOVA with Sidak’s multiple comparisons test vs. NT, and g1 vs g4; c two-way ANOVA with Sidak’s multiple comparisons test between g4 vs. NT in each group. Unpaired two-tailed Student’s t tests were performed in (d, e). *P < 0.05, **P < 0.01, ***P < 0.001, ****P < 0.0001. The P value and source data are provided as a Source Data file.

