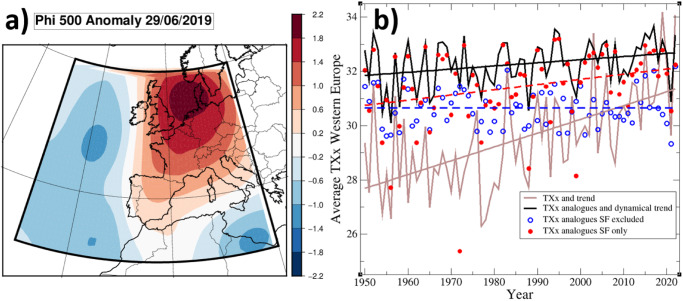
Fig. 2. Southerly flow anomalies and their contributions to summer temperature maxima.
a 500 hPa Streamfunction anomaly (Phi 500) of the 29/06/2019; b yearly time series of the Western Europe average of Summer maximal temperature TXx (brown), the TXx of the analogue time series, averaged over Western Europe and using the 3 best analogues (black curve) (see Methods), and the corresponding time series obtained by excluding (resp. including only) Southerly Flow (SF) pattern dates before calculating the analogue TXx values (blue circles, resp. red circles). The sets of dates (SF dates or SF excluded dates) within a year over which the yearly maximum is sought are therefore complementary. In each case, analogues are calculated using the full set of patterns (i.e. for SF excluded dates, analogues may contain SF patterns). Linear trends for all series are also shown, with the same color as the series. The dashed trends are for SF-only or SF-excluded cases.

