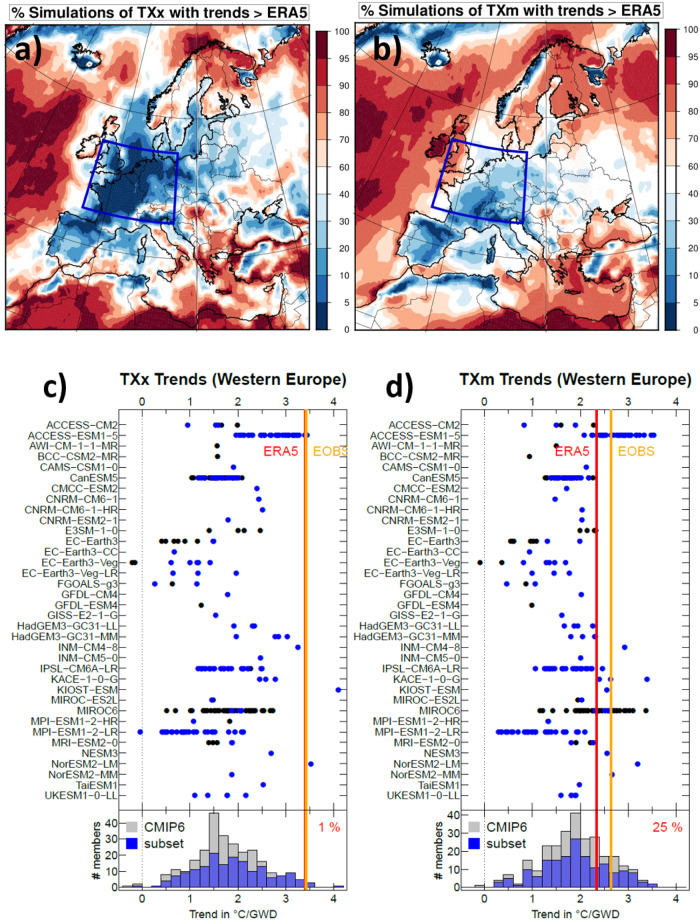
Fig. 3. Simulated vs. observed TX trends in Western Europe.
Comparison between the ECMWF reanalysis ERA5 and 273 CMIP6 simulations of trends in Summer maximum summer of daily maximum temperature, TX, (TXx, a) and c) and summer mean summer TX (TXm, b) and d) in °C/GWD represented in different ways; top panels: percentage of simulations with a trend larger than ERA5 at each grid point; bottom panels: representation of trends for model ensembles (dots) and observations (red and orange lines) after averaging over Western Europe (5°W to 15°E; 45°N-55°N); blue dots represent the 170 simulations that were analyzed with the analogue approach. Histograms at the bottom of the figure summarize the overall distribution of the TXx (left) and TXm (right) trends across the 273 simulations considered, together with the (blue) part analyzed with the analogue approach. Percentages of simulations with a trend larger than ERA5 are indicated in top right corners.

