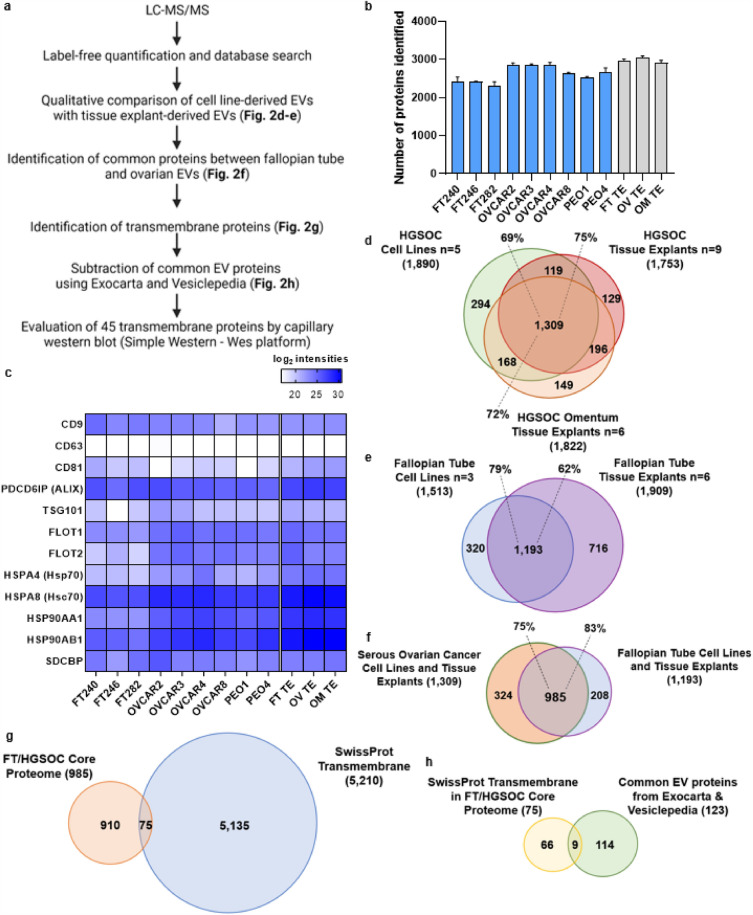
Figure 2.
Proteomic analysis of tissue explant and cell line EVs. (a) Pipeline for filtering LC–MS/MS data to aide in selection of potential transmembrane candidate protein biomarkers. Created with BioRender.com. (b) Shown are the initial number of proteins identified in cell line EVs (blue, average of two or three EV isolations from conditioned media) and tissue explant EVs (gray, average of all samples from their respective groups). (c) Heatmap of proteomic data showing enrichment of common EV protein markers for both cell line and tissue derived EVs. (d) Venn diagram comparison of protein distribution between HGSOC cell lines and tissue explants, and (e) between FT cell lines and FT tissue explants. (f) Identification of the FT/HGSOC core proteome by comparison of common proteins between the two groups (HGSOC EVs and FT EVs). (g) Identification of transmembrane proteins within the FT/HGSOC core proteome by comparison to the SwissProt predicted transmembrane database, and (h) removal of expected/common EV proteins within the transmembrane FT/HGSOC core proteome by comparison to the Exocarta and Vesiclepedia.

