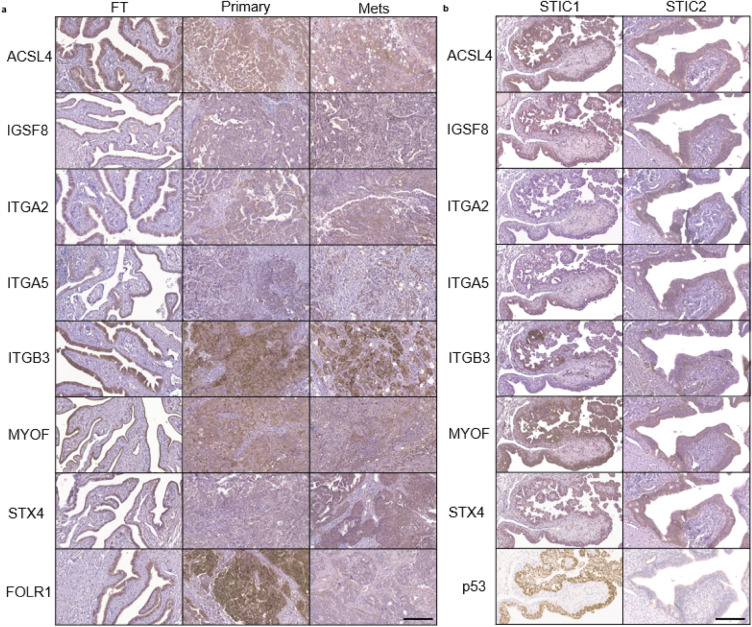
Figure 4.
Immunohistochemistry staining of tissues from patients with HGSOC and FT tissue with STICs show expression of the candidate transmembrane proteins. (a) Representative IHC images from the tissue microarrays consisting of 100 patient samples containing benign FT, primary, and metastatic tumor tissue sections are shown for all markers except ITGA2; for ITGA2, tissue samples with higher IHC scores were selected for this figure. Supplementary Fig. 7 shows the IHC scores of all tissue samples used in the study. FOLR1 was included as a positive control for IHC staining. (b) p53-overexpressed STIC and p53-null STIC tissue sections from RRSO. p53 staining was done using an automated Dako Autostainer Link; a manual staining protocol was performed for the other markers. The scale bars represent 200 µm. Macro-tissue arrays of tissue sections representative of HGSOC, kidney, liver, placenta, spleen and tonsil were used as negative and positive controls. These macro-tissue arrays were also used in optimizing the antibody concentrations.

