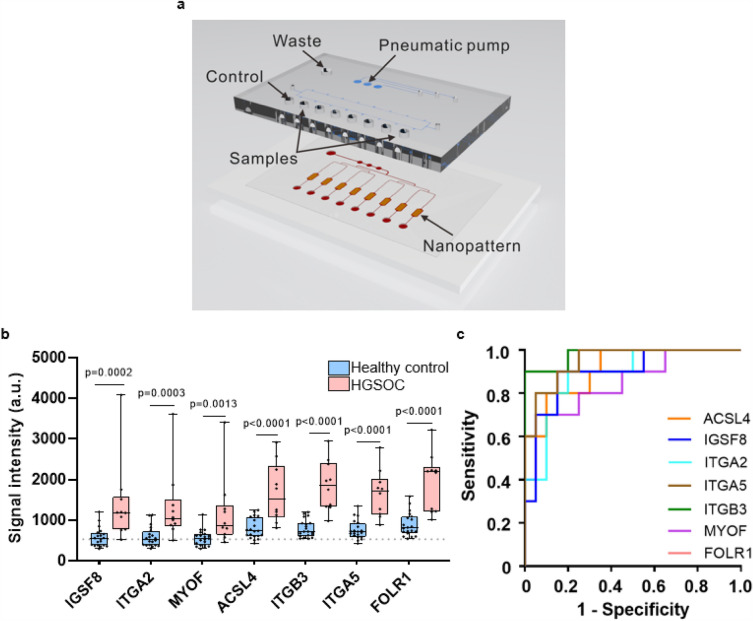
Figure 5.
Evaluation of transmembrane exo-proteins in plasma samples using ExoProfile chips. (a) Image of an ExoProfile chip consisting of 8 nanopatterned parallel channels for EV capture. (b) Quantification of transmembrane exo-protein biomarkers on captured CD81 + EVs for HGSOC (n = 10) and healthy control (n = 20) (dotted line signifies background fluorescence from a negative control channel labeled as BKG). FOLR1 was included as a previous positive control for HGSOC32. p-values were calculated using Mann–Whitney U test. (c) Area under the curve plot of receiver operating characteristic analyses for all the six markers and FOLR1 are shown.

