Figure 6.
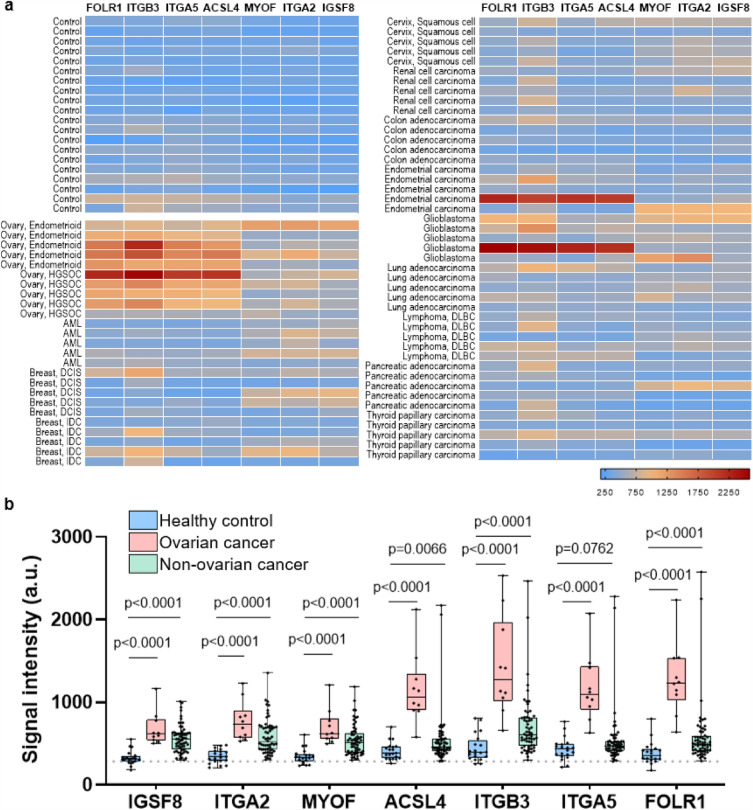
Specificity testing of transmembrane exo-proteins in plasma samples from different cancer types using the ExoProfile chip. (a) Heatmap showing the relative intensity distribution of each exo-protein marker across 90 plasma samples comprising of 12 non-ovarian cancers commonly diagnosed in women (n = 60; 5 per each cancer type), ovarian cancer (n = 10) and healthy controls (n = 20). (b) Quantification and comparison of transmembrane exo-protein biomarkers on captured CD81 + EVs in non-ovarian cancers (n = 60), ovarian cancers (n = 10), and healthy control samples (n = 20). The dotted line represents background fluorescence from a negative control channel. p-values were calculated using Mann–Whitney U test. These samples were subjected to two separate tests on different chips, and the reported values represent the average of two experiments. AML: acute myeloid leukemia, DCIS: ductal carcinoma in situ, IDC: invasive ductal carcinoma, DLBC: diffuse large B cell lymphoma.

