Fig. 4.
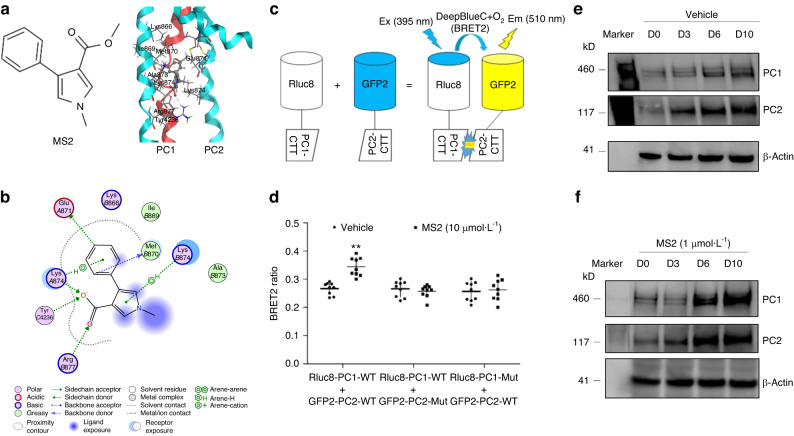
Cell-based BRET2 assays for MS2-target engagement assays. a Chemical structure of MS2 and an example of predicted 3D binding mode for MS2 (ball-and-sticks rendering in CPK colors) in PC2 (light blue). PC1 (red) as bound to PC2 in the homology structure is superimposed. b An example of calculated 2D binding mode and residues for MS2 in PC1/PC2 C-tails. c A diagram of BRET2 constructs and reactions in the presence of DeepBlue C with or without MS2 stimulation. d BRET2 signal changes from wild-type and mutant constructs with or without MS2 incubation. e, f Time-dependent changes of PC1 and PC2 proteins with or without MS2 incubation during osteogenic differentiation cultures in MC3T3-E1 cell line. Incubation Data are presented as the mean ± SD from 3 independent experiments (n = 3). **P < 0.01 compared with vehicle control

