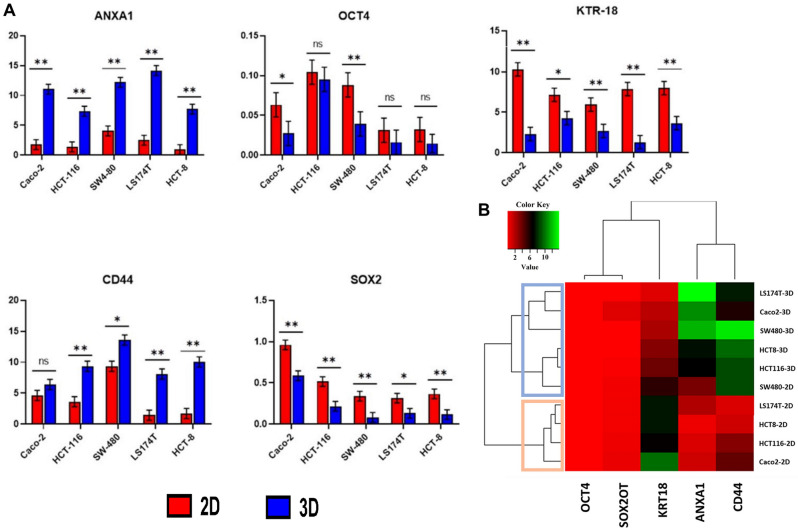
Figure 3.
(A) RT-qPCR analysis comparing gene expression of ANXA1, CD44, KRT18, OCT4, and SOX2OT genes in CRC cell lines across different culturing techniques. Data represented as mean ± standard deviation of the normalized fold change of three independent experiments. * p < 0.05; ** p < 0.01; NS: Non-significant; 2D: Two- Dimensional; 3D: Three- Dimensional. (B) Gene expression analysis of CRC cell lines grown in 2D and 3D culture conditions. Sample data were pooled and normalized to compute the cluster dendrogram. Heat map representing gene at two experimental conditions clustered based on expression values (used heatmapgenerator5 tool).

