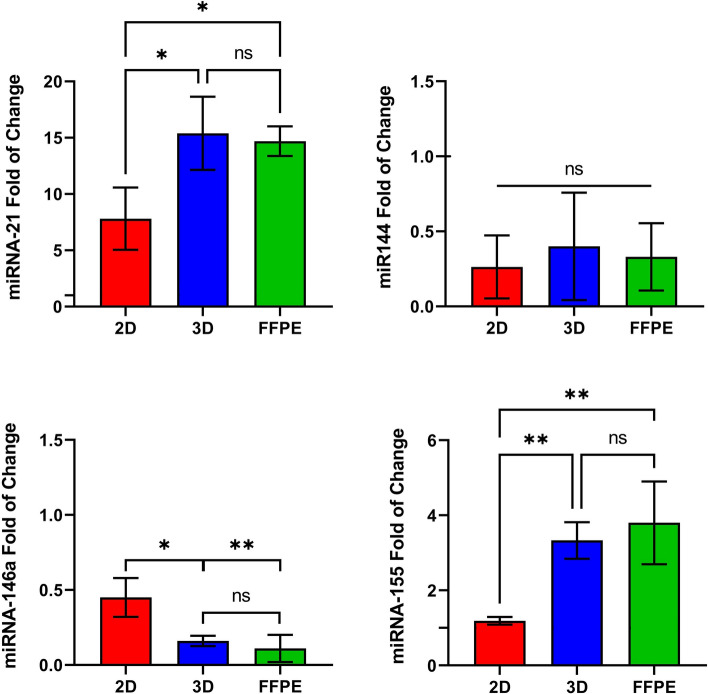
Figure 4.
miR-21, miR-144, miR-146a, and miR-155 expression in CRC cell lines cultured in both 2D and 3D cell culture models compared with FFPE colorectal block samples. The results were normalized to RNU43 as an endogenous control. Results represent the mean ± standard deviation of three independent experiments. * p < 0.05; ** p < 0.01; NS: Non-significant; FFPE: Formalin-Fixed Paraffin-Embedded; 2D: Two- Dimensional; 3D: Three- Dimensional.

