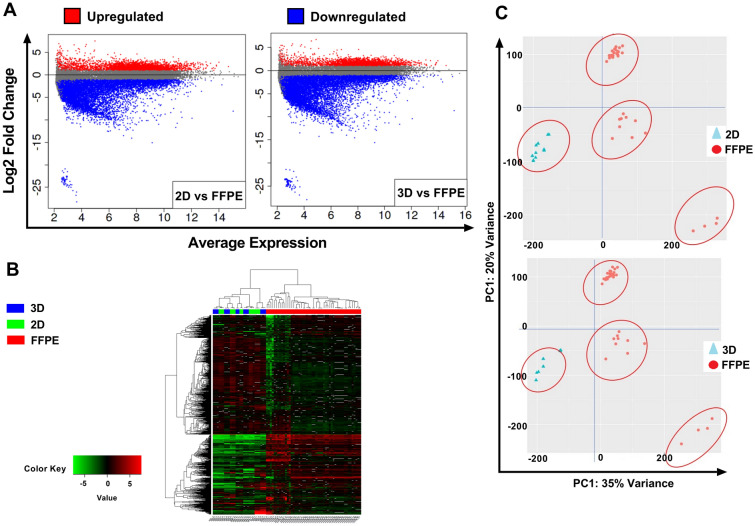
Figure 6.
(A) Mean-Average (MA) plots of log2 fold change versus log2 average expression between the type of culture condition and FFPE samples. Each dot represents a gene. Log2 fold change above 0 indicates genes with upregulated expression, while lower than 0 indicates genes with down-regulation. Red and blue dots indicate genes that significantly differ in gene expression (p-adj < 0.05). (B) Hierarchical clustering heat map of log2 expression levels of most significantly (p-adj < 0.05) expressed genes resulting from RNA sequencing analysis of (Green) 2D cultured cells with FFPE samples (Blue) 3D cultured cells with FFPE samples. Sample data were pooled and normalized with DeSeq2, followed by H-clustering to compute the cluster dendrogram. (C) Principal-component analysis of sample relationship. PCA 1 is 35% and 34% variance for the relationship between 2D/3D with FFPE data. PCA2 is 20% for both. Cell lines for 2D and 3D culture conditions are clustered in one group apart from FFPE clustering. FFPE: Formalin-Fixed Paraffin-Embedded.

