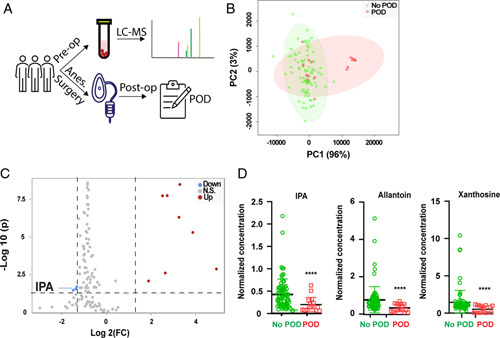
FIGURE 1.

Microbiome derived metabolite, IPA, is implicated in POD. (A) Flowchart for human subjects study. Plasma samples were obtained before anesthesia and surgery (N=103), followed by LC-MS metabolomic examination. All subjects were followed up for the development of POD. Comparisons were made in metabolomics between subjects with POD (N=17) and those without POD (N=86). (B) Principal component (PC) analysis. PC1 and PC2 could separate subjects with POD from those without POD. (C) Volcano plot of all metabolites. X axis: log2 fold-of-change (Log2 FC); Y axis: −log 10 (adjusted P value). Cutoff was set using FC 2.5 and adjusted P value of 0.05. Blue color represents metabolites that were decreased in POD group, whereas red color represents metabolites that were increased in POD group. (D) Comparison of 3 metabolites identified by volcano plot. ****P<0.0001 with t test, when adjusted for repetitive measurements, all 3 P values were less than 0.05. IPA indicates indole-3-propionic acid; LC-MS, liquid chromatography with tandem mass spectrometry; POD, postoperative delirium.
