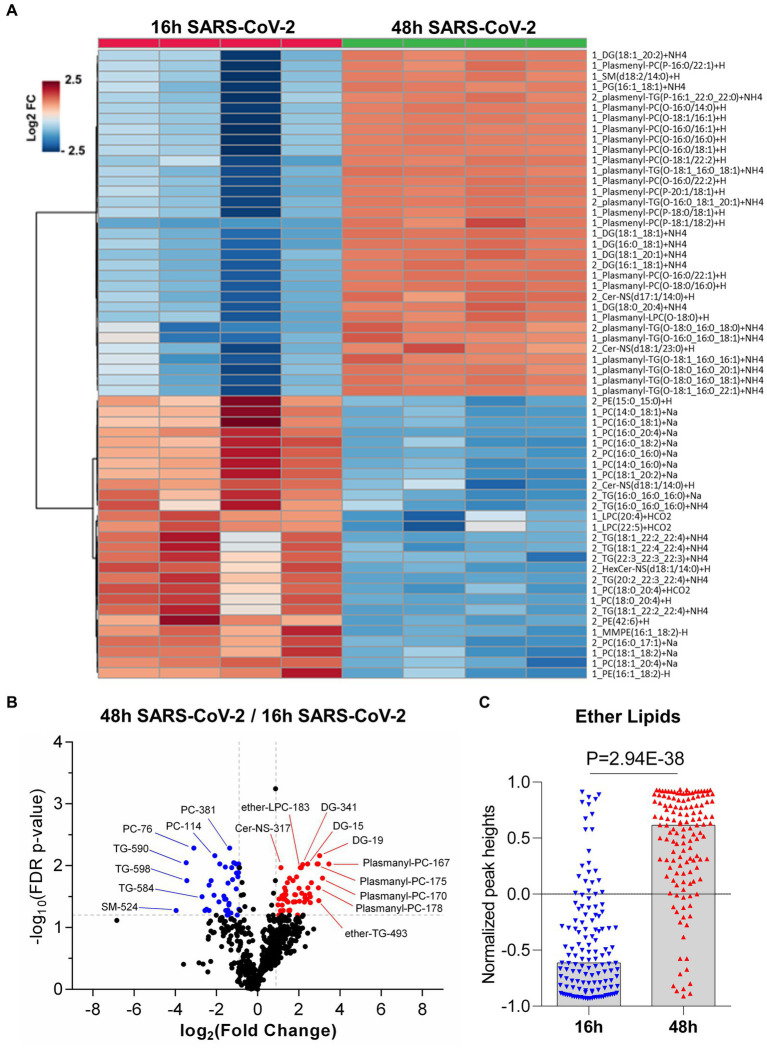
Figure 5.
Global lipidomics analysis in SARS-CoV-2 infected Vero E6 cells at 16 h and 48 h. (A) Hierarchical cluster heatmap analysis depicting the major affected lipid clustering between 16 h and 48 h infection. (B) Volcano plot showing the differential lipid abundance with SARS-CoV-2 infection between 16 h and 48 h. The primary significantly upregulated lipids include plasmalogens, diglycerides and triglycerides. (C) Bar graph showing the total abundance of ether lipids between the time points. Lipid molecule abbreviations (shown in panel B): PC-76 [1_PC (16,0_20:4) + Na], PC-114 [1_PC (18,1_20:4) + Na | 1_PC (16,0_22:5) + Na], PC-381 [2_PC (16,0_17:1) + Na | 2_PC (15,0_18:1) + Na], TG-584 [2_TG (18,1_22:4_22:4) + NH4], TG-590 [2_TG (20,2_22:3_22:4) + NH4], TG-598 [2_TG (22,3_22:3_22:3) + NH4], SM-524 [2_SM (d17:1/20:3) + H], Cer-NS-317 [2_Cer-NS (d17:1/14:0) + H], DG-15 [1_DG (16,0_18:1) + NH4 | 1_DG (16,1_18:0) + NH4], DG-19 [1_DG (18,1_18,1) + NH4 | 1_DG (16,0_20,2) + NH4 | 1_DG (16,1_20,1) + NH4 | 1_DG (18,0_18,2) + NH4], DG-341 [2_DG (16:1_18:1) + NH4 | 1_DG (16,1_18,1) + NH4 | 1_DG (16,0_18,2) + NH4 | 1_DG (14,0_20,2) + NH4], Ether-LPC-183 [1_Plasmanyl-LPC (O-18:0) + H], Ether-TG-493 [2_plasmanyl-TG (O-16:1_20:0_20:0) + NH4 | 2_plasmenyl-TG (P-16:0_20:0_20:0) + NH4], Plasmanyl-PC-167 [1_Plasmanyl-PC (O-18:0/16:0) + H], Plasmanyl-PC-170 [1_Plasmanyl-PC (O-16:0/22:2) + H], Plasmanyl-PC-175 [1_Plasmanyl-PC (O-16:0/22:1) + H], and Plasmanyl-PC-178 [1_Plasmanyl-PC (O-18:1/22:2) + H | 1_Plasmenyl-PC (P-18:0/22:2) + H].

