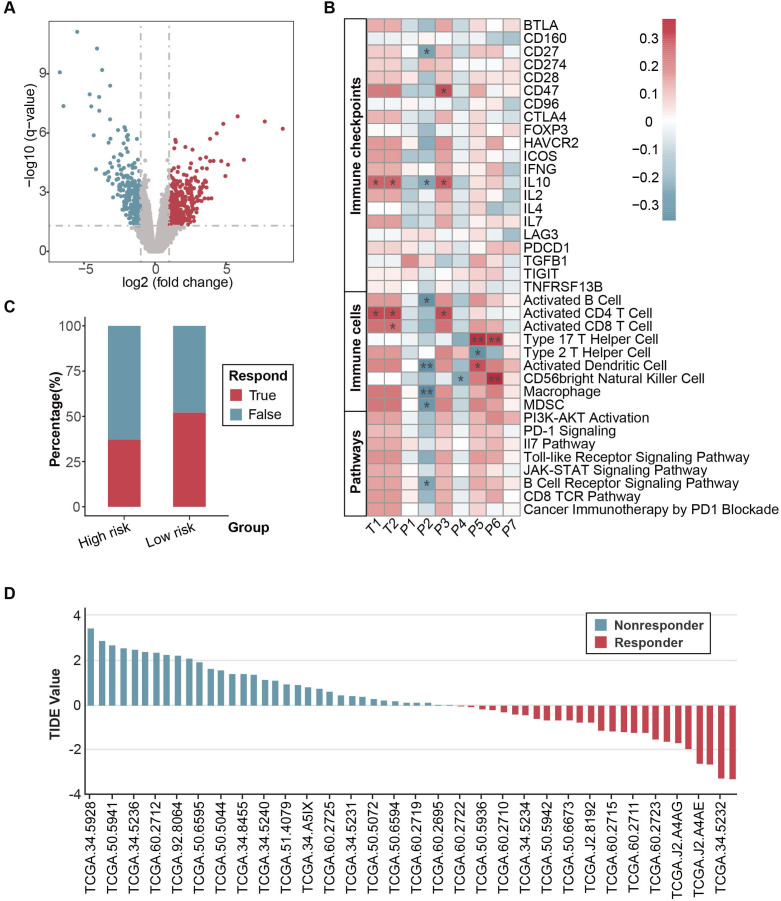
Figure 7.
Biological validation of CRS in TCGA-NSCLC cohort. (A) The volcano plot indicates differentially expressed genes in the TCGA-NSCLC cohort. (B) Correlation analysis between radiomic features with immune checkpoints, immune cells, and immune-related pathways. (C) Predicted responders of immunotherapy in TCGA-NSCLC cohort through transcriptomic data by TIDE algorithm. (D) Distribution of TIDE value TCGA-NSCLC cohort. CRS, combined radiomic signature; NSCLC, non-small cell lung cancer; TCGA, The Cancer Genome Atlas; TIDE, Tumor Immune Dysfunction and Exclusion.

