
Figure 11.
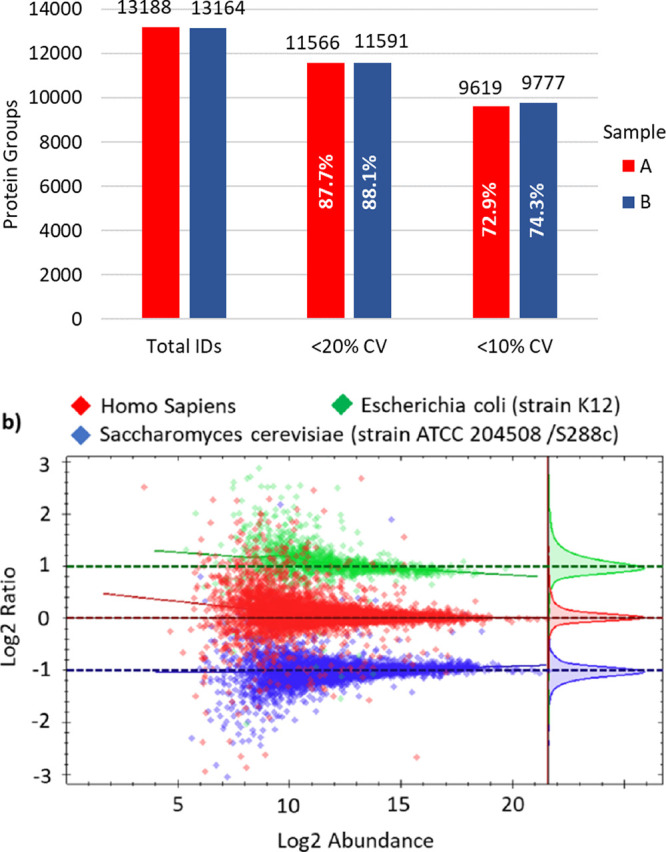
Comparative analysis of 500 ng 3-proteome mixtures (E. coli, HeLa, and yeast) at 2:3:1 and 1:3:2 ratios for samples A and B, respectively. (a) Protein identifications at various coefficients of variation between triplicate runs. (b) Average Log2 ratio of yeast and E. coli protein intensities between samples A and B.