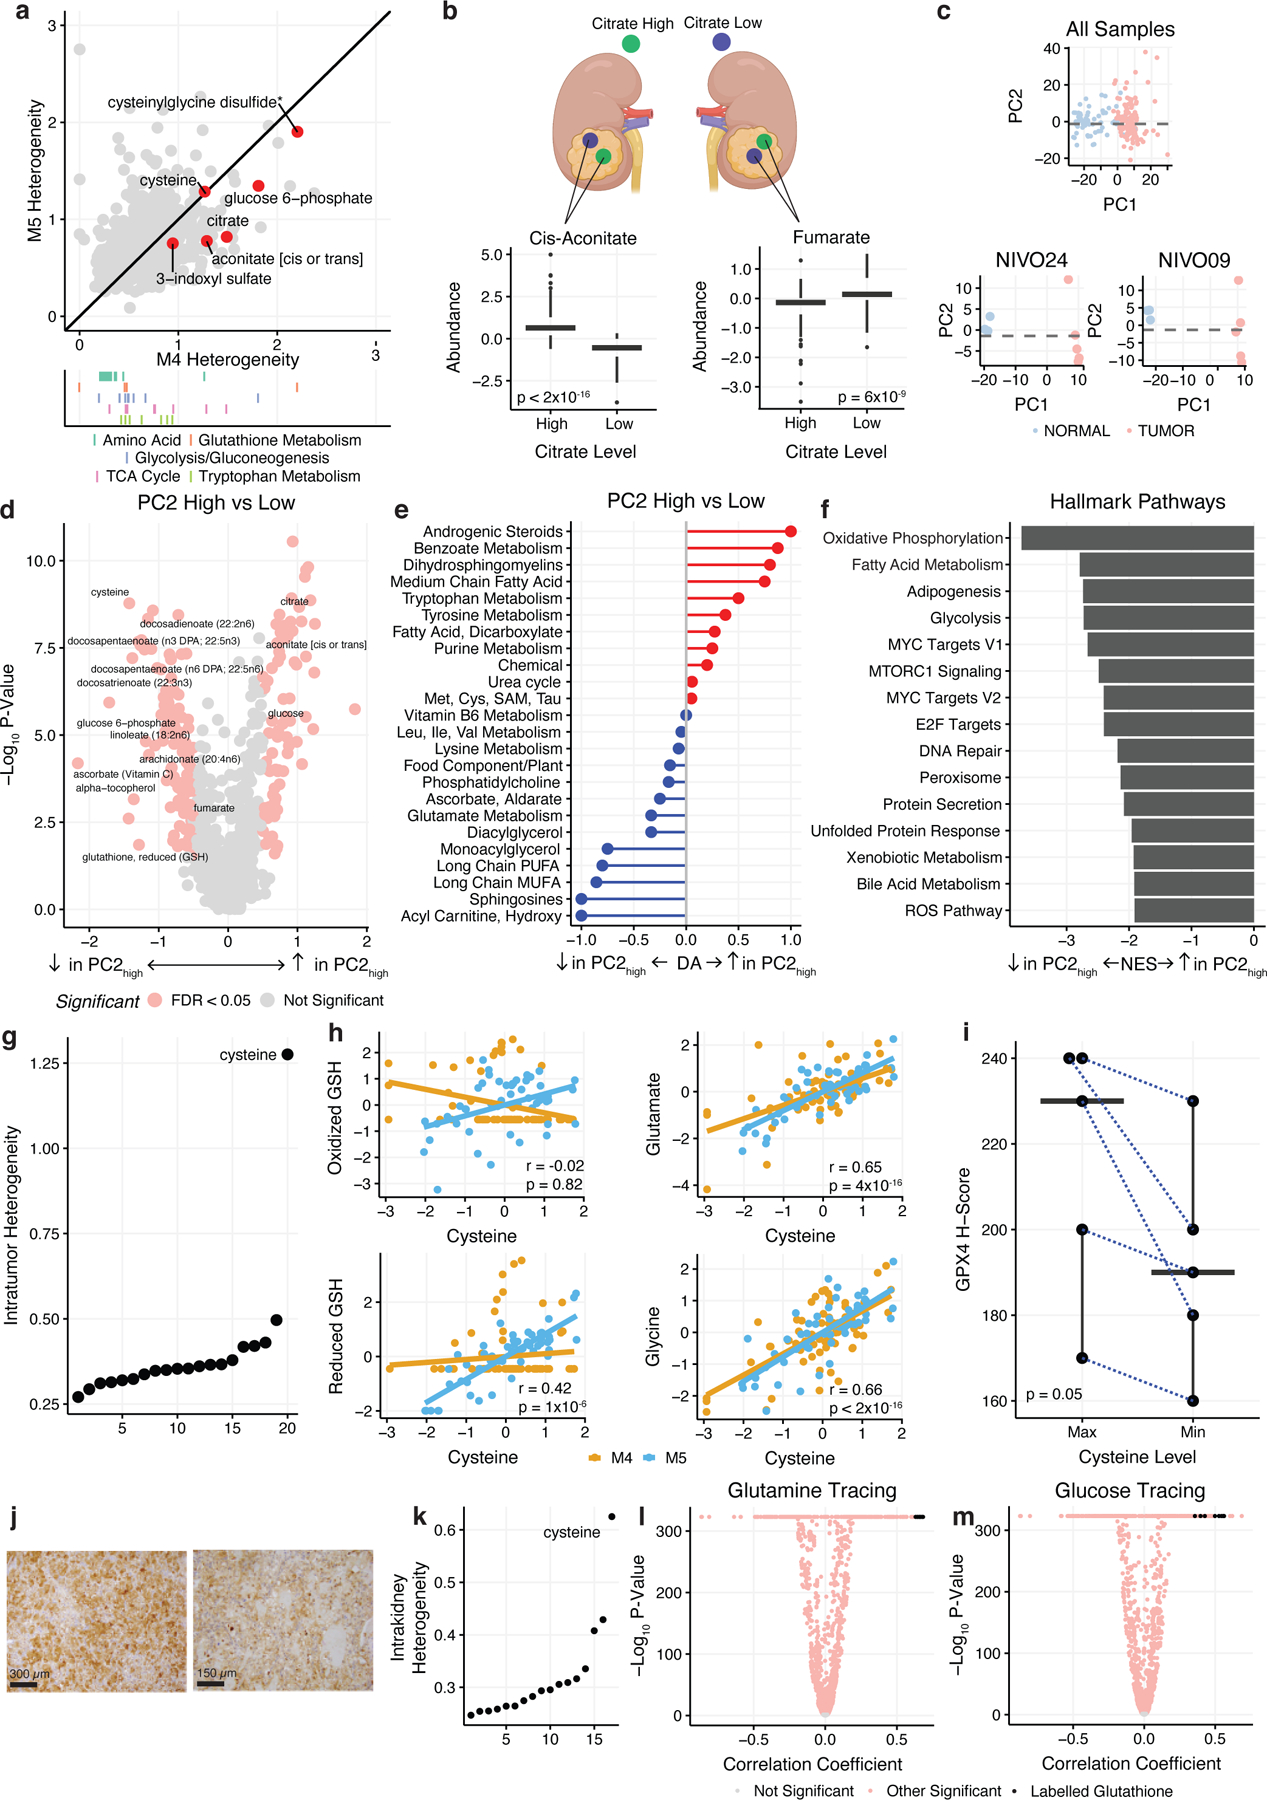
Figure 3. A Ferroptotic-Compensation Program Underlies IMH in ccRCC.

a) Top: Scatterplot of intratumor heterogeneity of individual metabolites in M4 vs M5. Bottom: Rug plot highlighting metabolites in important metabolic pathways. b) Top: Schematic demonstrating citrate high and citrate low regions within a single tumor. Bottom: Boxplots comparing cis-aconitate and fumarate levels in citrate high vs citrate low regions. c) Top: PCA analysis of all multiregion samples colored by tumor and normal. Bottom: PCA analysis of samples from single patients, NIVO09 and NIVO24 colored by tumor and normal. PC1 separates tumor and normal samples while PC2 separates tumor regions within individual patients. d) Volcano plot of metabolites differentially expressed in PC2low vs. PC2high tumor regions colored by significance. Metabolites in red are significant (FDR-adjusted p-value < 0.05 and absolute log2 fold-change > 0.5). e) Pathway-based analysis of metabolic changes in PC2high vs PC2low regions. f) GSEA results comparing PC2low to PC2high regions. All pathways shown are statistically significant (FDR-adjusted p-value < 0.05). g) Cysteine is exceptional in the magnitude of IMH relative to other proteinogenic amino acids. h) Scatterplots of scaled cysteine expression vs oxidized glutathione, reduced glutathione, glutamate, and glycine. Yellow represents samples from the M4 batch, blue represents samples from M5 batch. i) Boxplot comparing GPX4 H-scores in maximum cysteine expression regions vs minimum cysteine expression regions. Maximum and minimum samples selected are paired from the same patient. GPX4 protein expression is elevated in cysteine-high regions. j) GPX4 staining of a cysteine maximum (top) and cysteine minimum (bottom) region from a single patient (MR06). Bar represents 300 µm (top) and 150 µm (bottom). k) Intrakidney heterogeneity of amino acids from spatial mouse kidneys. l) Volcano plots from correlating cysteine abundance with labeling patterns from experiments using uniformly-labeled glutamine. Black dots indicate labelled glutathione isotopologues (i.e. excluding glutathione m+0). k) Intrakidney heterogeneity of amino acids from spatial mouse kidneys. m) Volcano plots from correlating cysteine abundance with labeling patterns from experiments using uniformly-labeled glucose. Black dots indicate labelled glutathione isotopologues (i.e. excluding glutathione m+0).
