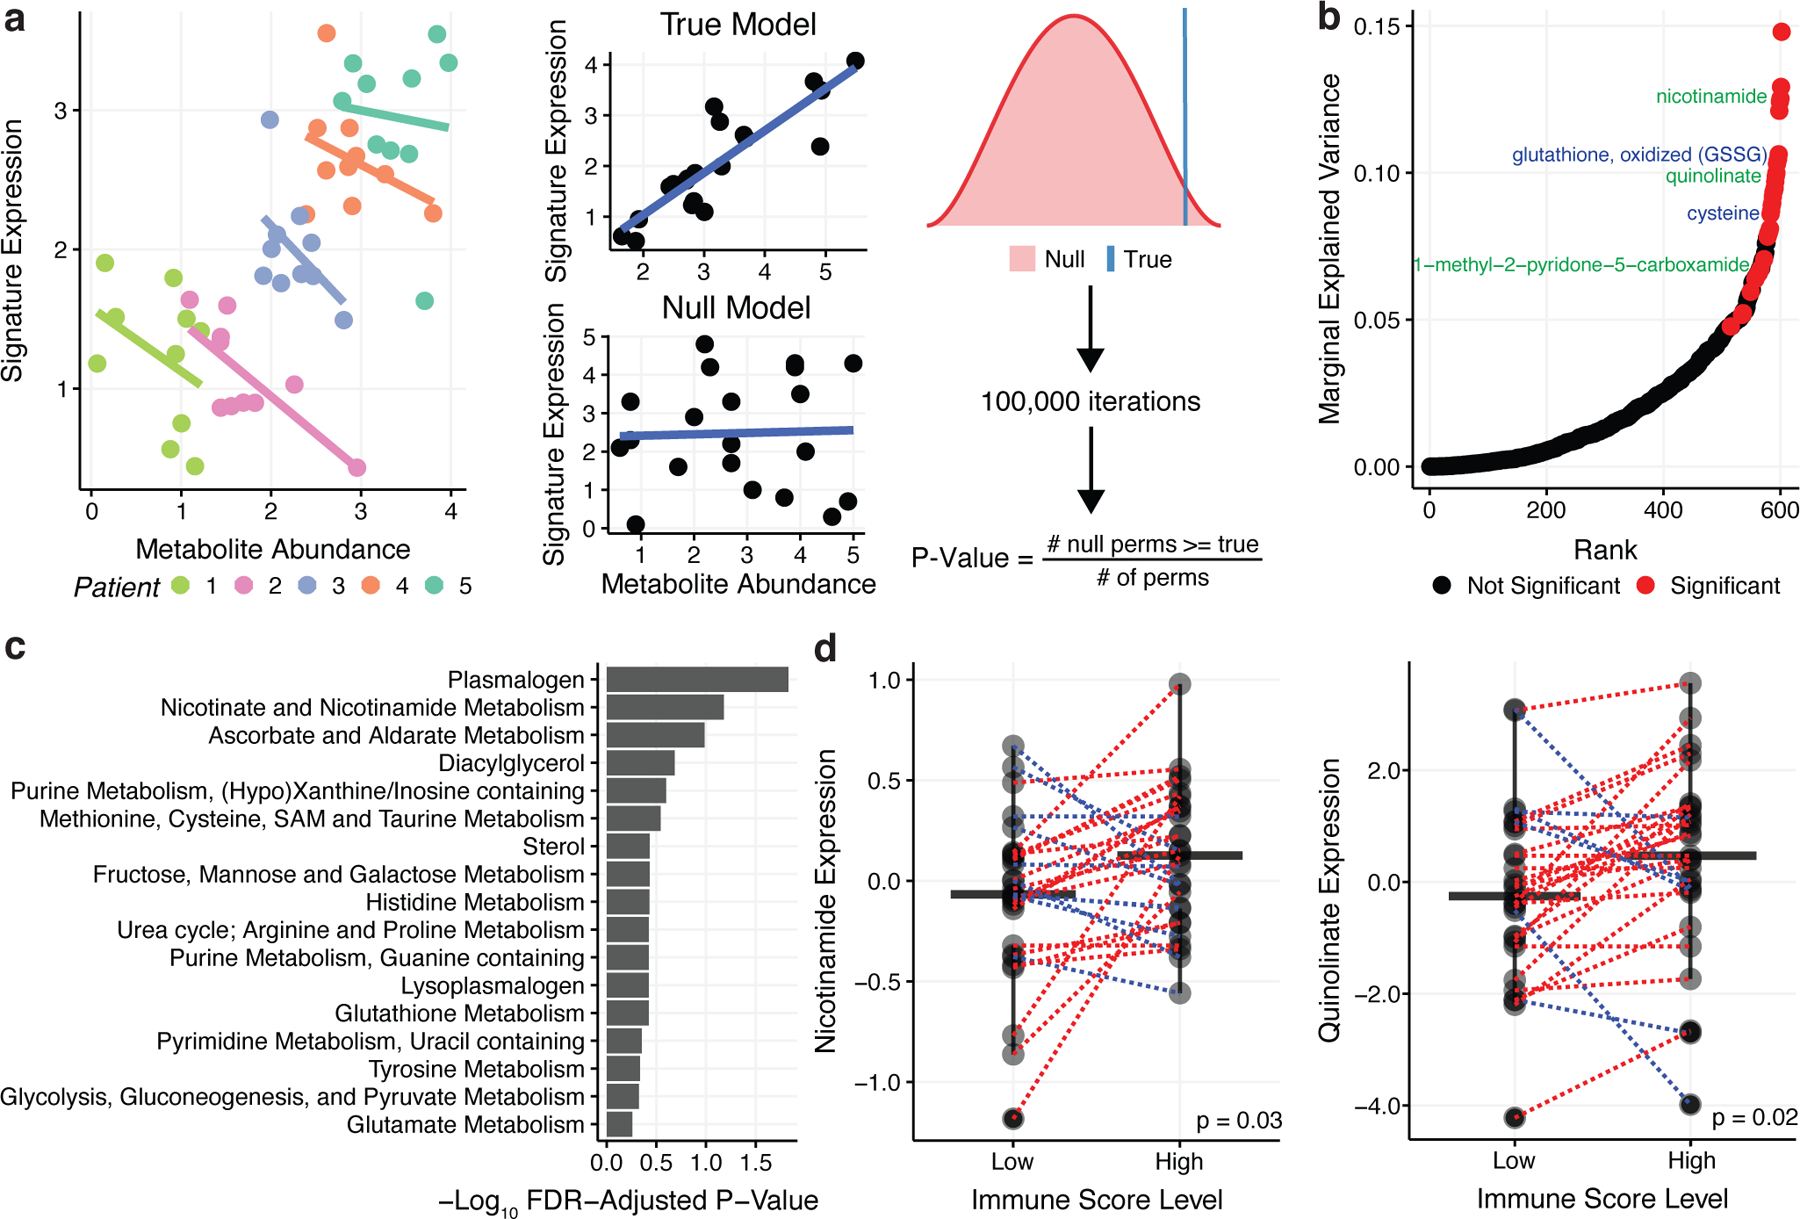
Figure 4. Immune Infiltration in the ccRCC Tumor.

a) Left: Scatterplot illustrating Simpson’s paradox, where non-independence in data due to a patient-level random effect, confounds the co-expression pattern between two variables. Right: In parametric bootstrapping the true model is compared to the null model where the p-value is the fraction of times the null model a test statistic from the null model exceeds the true test statistic. 100,000 bootstraps were performed. b) Marginal explained variance in a mixed-effects linear model of metabolite levels predicting Immune Score with patient added as a random effect. Each dot represents a single metabolite. Significant metabolites in the NAD+ metabolism pathway are labeled in green while significant metabolites in the glutathione pathway are labeled in blue. c) Fisher’s exact test was performed on pathways with 3+ metabolites to determine pathways with a significantly higher proportion of their metabolites associated with Immune Score based on the mixed effects model. The barplot shows FDR-adjusted p-values from Fisher’s exact test. d) Nicotinamide and quinolinate levels are elevated in tumor regions with high immune infiltration relative to paired tumor regions with low immune infiltration.
