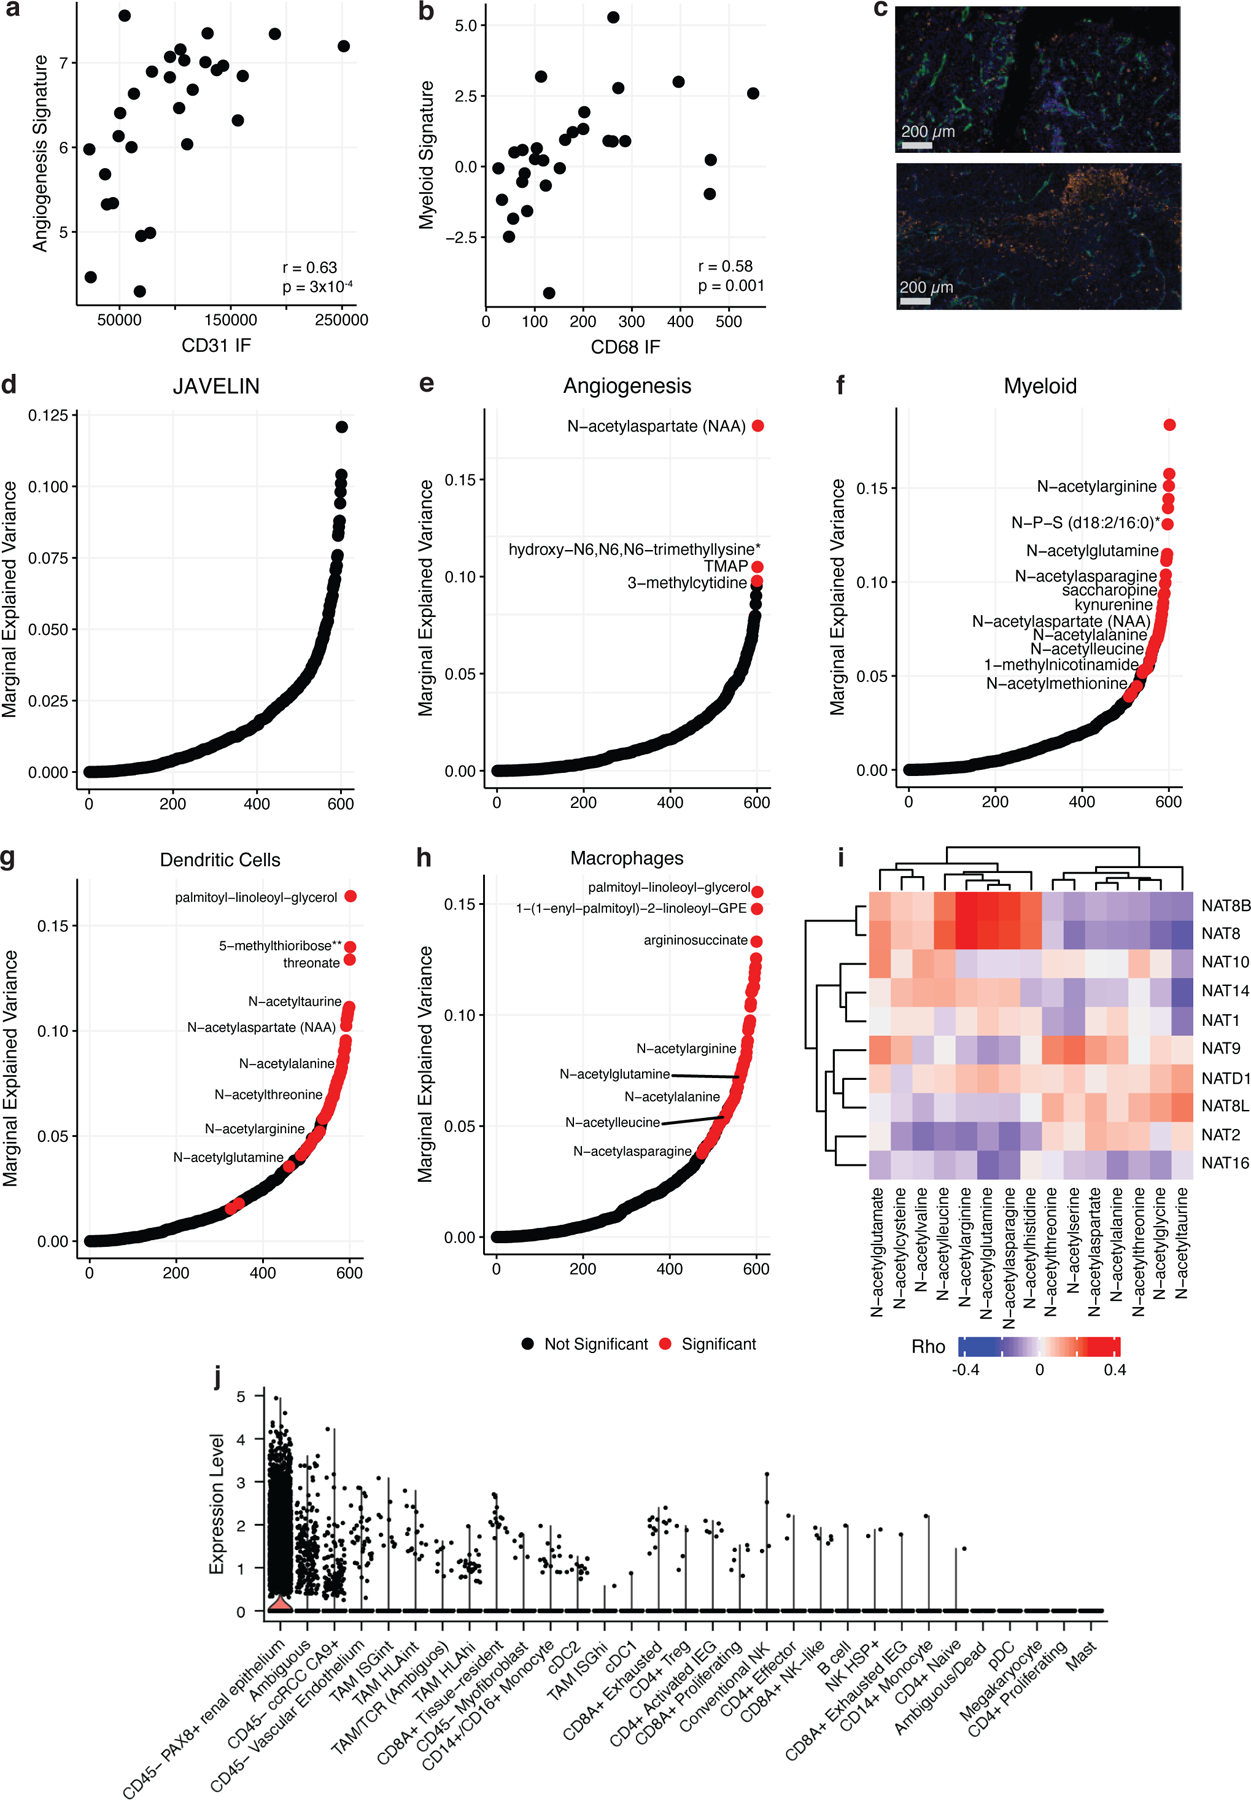
Figure 5. Metabolic Features of Prognostic Immune Signatures in ccRCC.

a) Left: Scatterplot comparing CD31 levels from IF staining to expression levels of the McDermott Angiogenesis signature. b) Left: Scatterplot comparing CD68 levels from IF staining to expression levels of the McDermott Myeloid signature. c) Top: Representative IF image of a tumor region (MR01 RB) with high CD31 expression (green) and low CD68 expression (orange). Bottom: Representative IF image of a tumor region (MR01 RE) with low CD31 expression and high CD68 expression. Bar represents 200 µm. Marginal explained variance in a mixed-effects linear model of metabolite levels predicting JAVELIN (d), McDermott Angiogenesis (e), McDermott Myeloid (f), dendritic cell (g), and macrophage (h) signature expression with patient added as a random effect. Each dot represents a single metabolite. Red dots indicate statistically significant associations. i) Heatmap Spearman correlation coefficients between NAT genes and n-acetylated amino acids. j) Boxplots of NAT8 expression levels across cell types in a single-cell ccRCC dataset.
