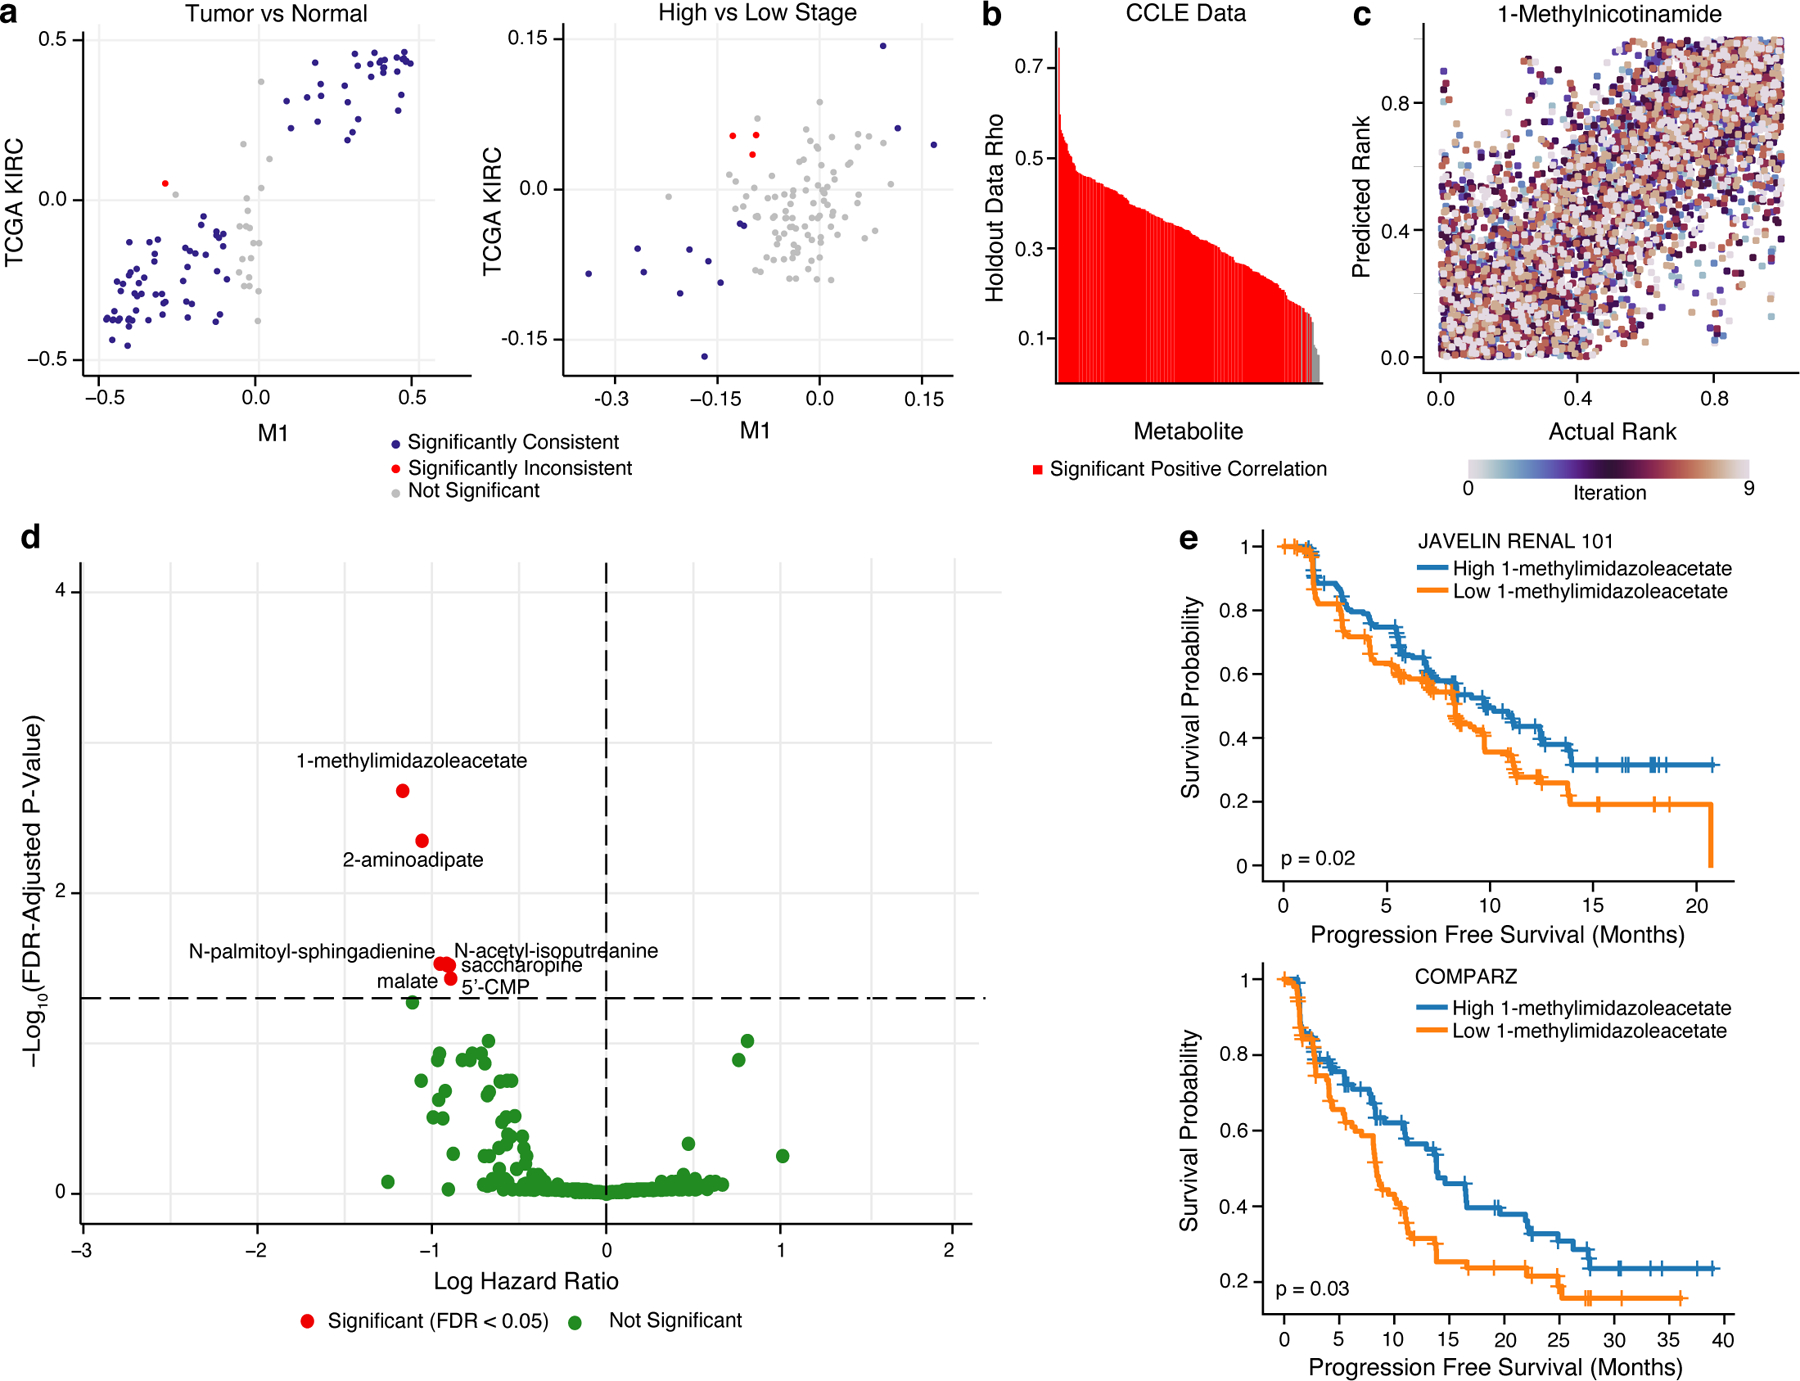
Figure 6. Metabolic profiles of response to sunitinib predicted by MIRTH.

a) Scatterplot comparing the differential abundance of imputed metabolites in TCGA KIRC to true metabolites in M1 between high and low stage tumors (left) or between tumor and normal samples (right). Metabolites in blue are consistently and significantly differentially enriched (FDR-adjusted p-value < 0.05 and rank difference > 0 or < 0 in both datasets, Wilcoxon rank sum test). b) Barplot of median Spearman’s correlation values for each simulated-missing metabolite in CCLE data across 10 MIRTH iterations. Metabolites whose predicted ranks are significantly correlated with ground-truth ranks in >90% of iterations are labeled red. Metabolites with significant negative correlations are discarded. c) Scatterplot of actual vs predicted ranks for 1-methylnicotinamide in CCLE data. Dots are coloured by iteration. d) Volcano plot of 262 reproducibly well-predicted metabolites associated with PFS in sunitinib arms of ccRCC clinical trials, colored by significance (Cox’s proportional-hazards test, adjusted by age and sex). Metabolites in red are significant (FDR-adjusted p-value < 0.05). X-axis is in natural log space. e) Kaplan–Meier plot showing sunitinib-treated ccRCC patients with a high level of 1-methylimidazole acetate (based on median level of 1-methylimidazole acetate) had improved PFS than patients with low level of 1-methylimidazole acetate in JAVELIN RENAL 101 (top) and COMPARZ (bottom) trial.
