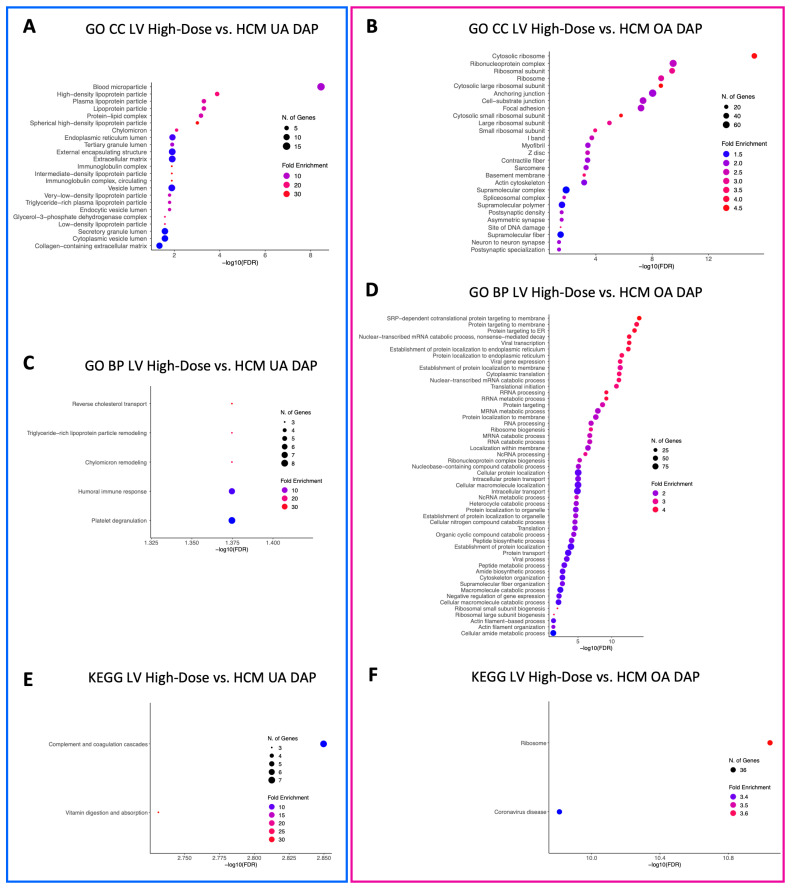
Figure 7.
Enriched terms for LV DAPs in the high-dose vs. HCM comparison. Enrichment plots for GO CC (A,B), GO BP (C,D), and KEGG pathway (E,F) term analyses are presented for under- (blue box) and overabundant (pink box) DAPs. The y-axis depicts identified enriched terms, whereas the x-axis depicts the terms’ significance (−log10[FDR]). The terms are sorted according to statistical significance; the top-most terms on the y-axis constitute the most statistically significant of terms. The size of individual points depicts the total number of proteins binned to a given enriched term; high or low fold enrichment is represented by red or blue coloring, respectively. Abbreviations: HCM = hypertrophic cardiomyopathy, LV = left ventricle, GO = gene ontology, CC = cellular components, BP = biological processes, UA = underabundant, OA = overabundant, DAP = differentially abundant peptide(s).

