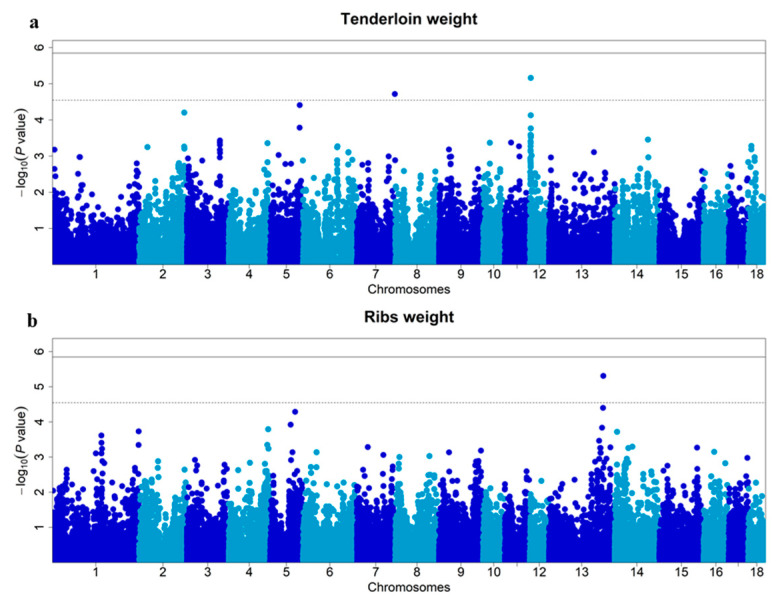
Figure 3.
Manhattan plots of GWAS for TLNW (a) and RIBW (b) in the DLY population. In the Manhattan plots, the solid and dashed lines represent the 5% genome-wide and chromosome-wide (suggestive) Bonferroni-corrected thresholds, respectively. The x-axis represents the chromosomes, and the y-axis represents the −log10 (p value).

