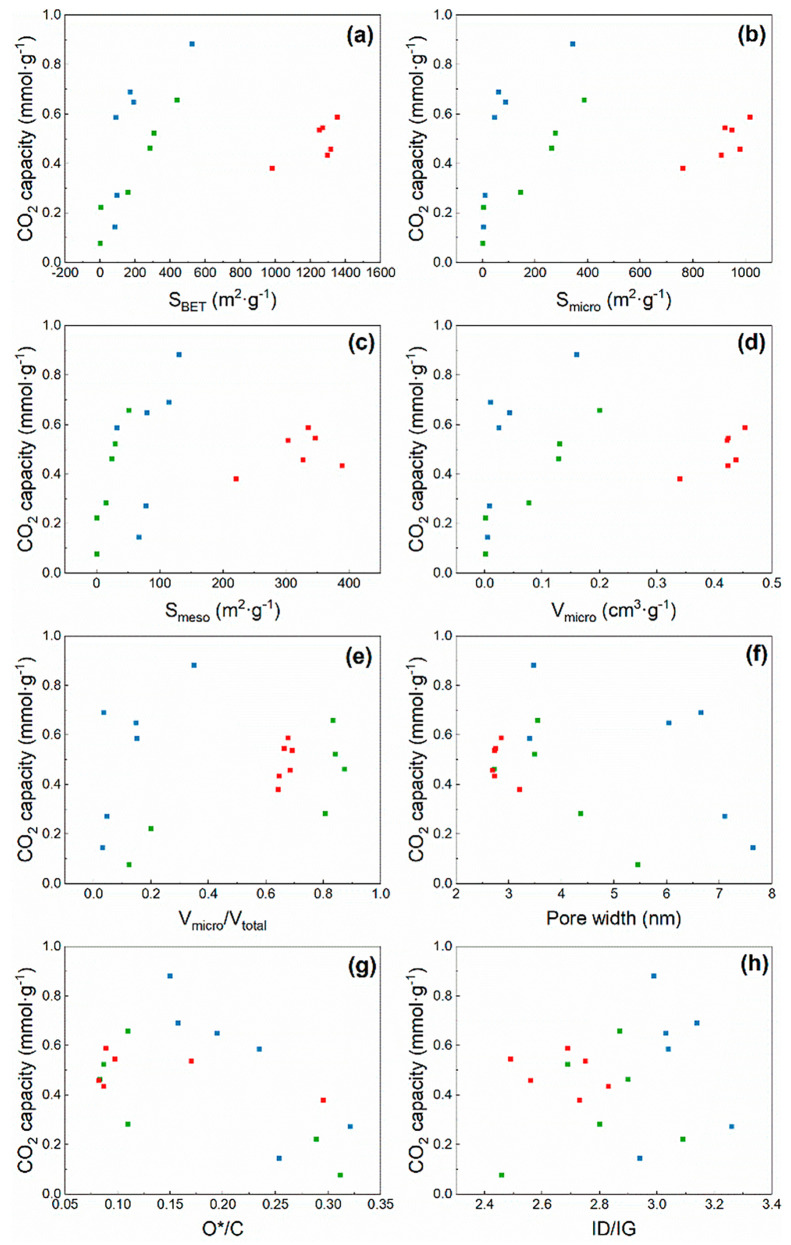
Figure 11.
Correlation analysis between the CO2 capture capacity obtained by the gas analyzer (BC-blue, WP-green, CS-red) and (a) BET surface area, (b) micropore surface area, (c) mesopore surface area, (d) micropore volume, (e) micropore volume/total pore volume, (f) pore width, (g) *O/C, and (h) ID/IG.

