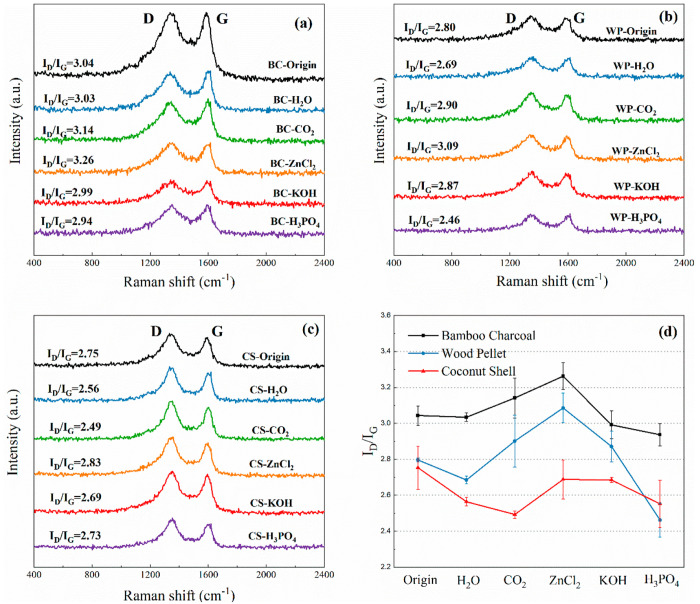
Figure 7.
Raman spectra of (a) bamboo charcoal; (b) wood pellet; and (c) coconut shell biochar fragments. All of the spectra show the D and G bands, indicating graphitic structures and defected graphitic structures, respectively; (d) ID/IG band ratio trend of bamboo charcoal, wood pellet, and coconut shell biochar.

