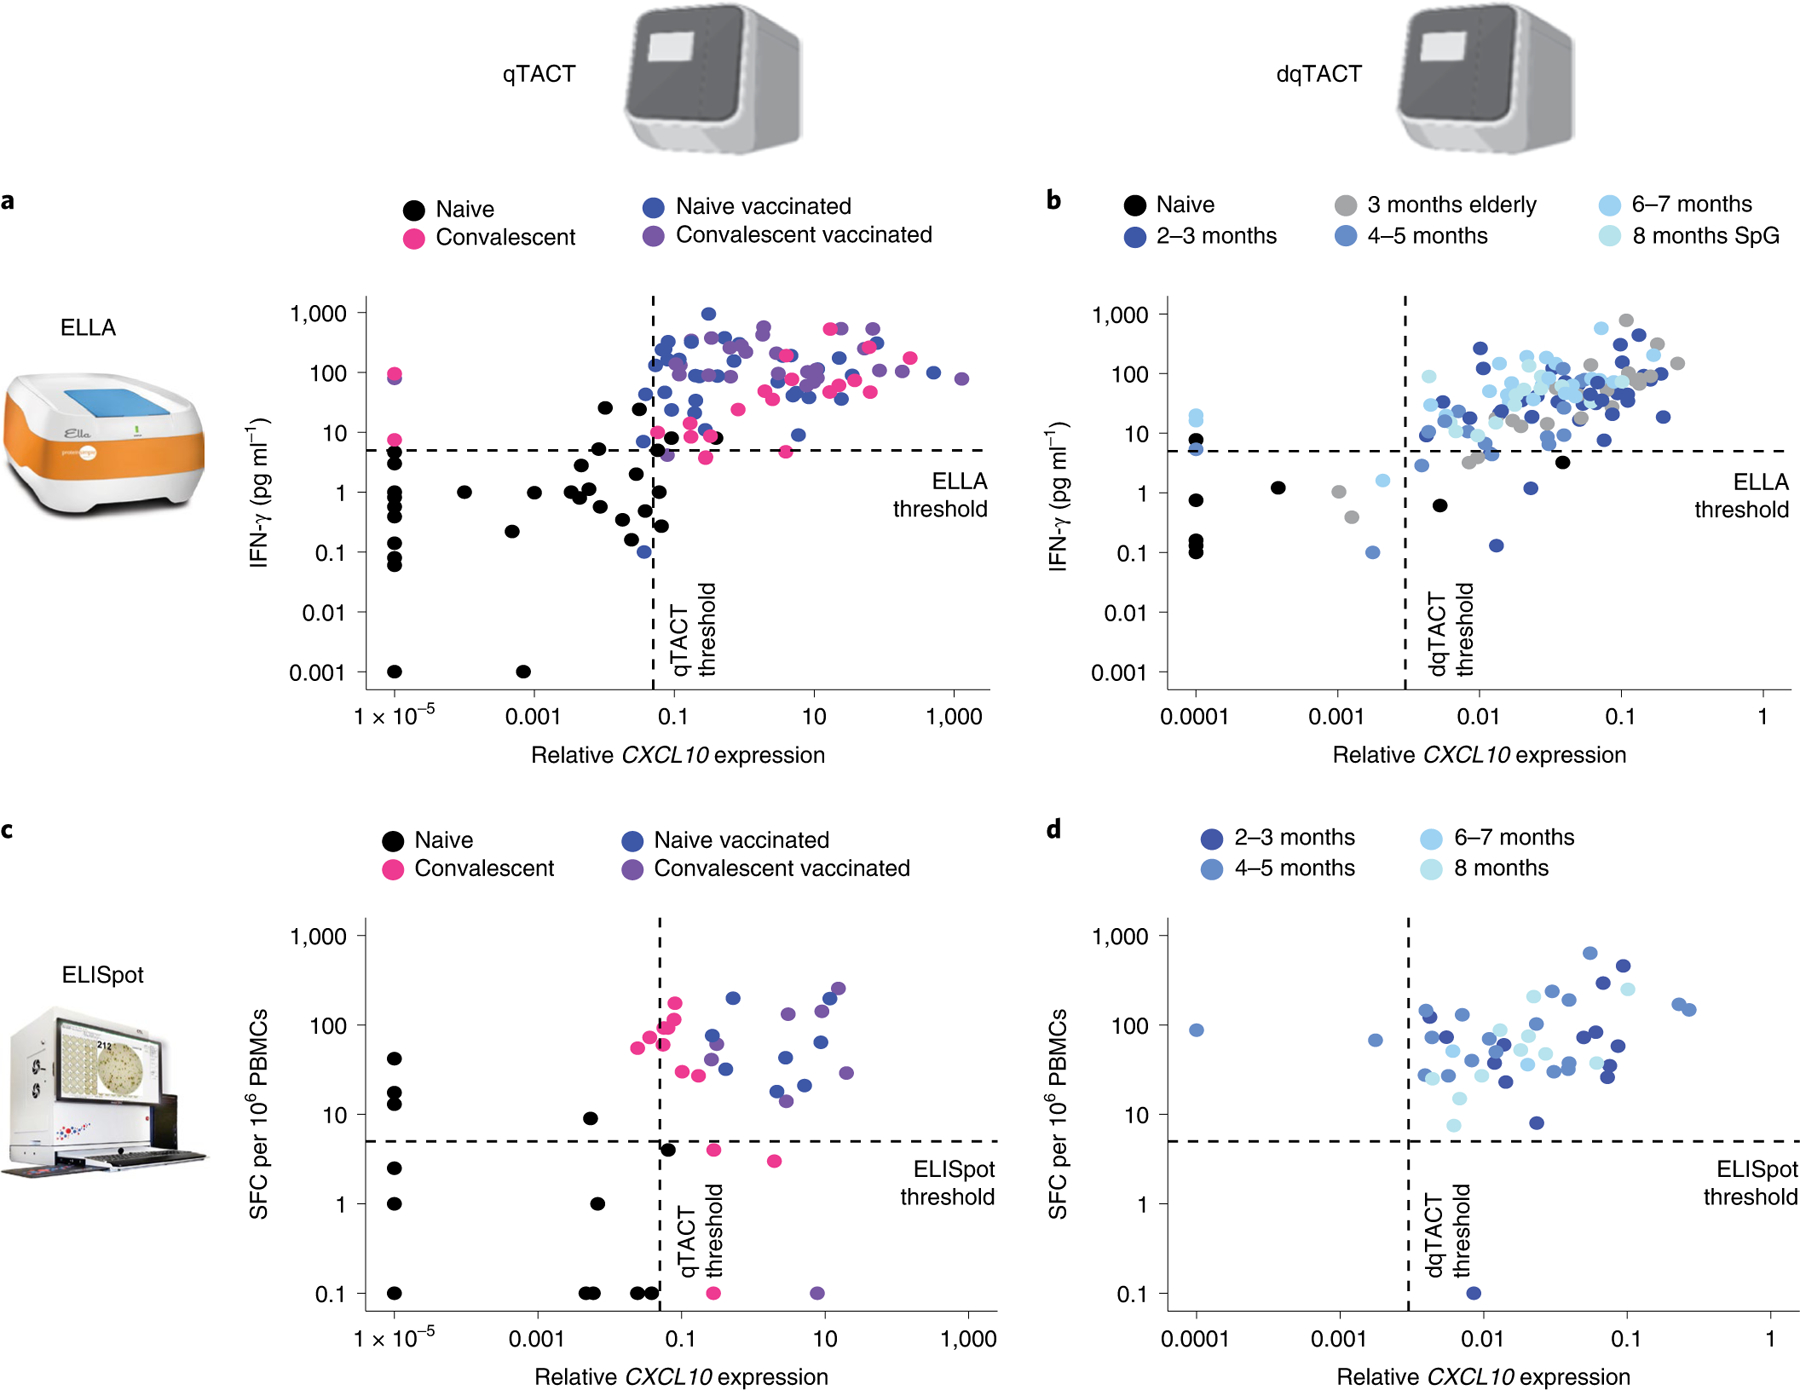
Fig. 3 |. TACT assays are concordant with gold standard ELLA and ELISpot assays.

a–d, Concordance between assays to quantify cellular immunity. The quantification shown is with the DMSO control subtracted from the spike peptide-stimulated sample. Each dot represents a unique participant color coded based on their COVID-19 and vaccination statuses (legend). The dashed line represents thresholds for each assay. a, Concordance between ELLA and qTACT assays. For 117 participants, IFN-γ protein secretion was quantified by ELLA (y axis) and CXCL10 mRNA by qTACT (x axis). b, Concordance between ELLA and dqTACT assays. For 133 participants, IFN-γ protein secretion was quantified by ELLA (y axis) and CXCL10 mRNA by dqTACT (x axis). c, Concordance between ELISpot and qTACT assays. For 50 participants, IFN-γ producing cells were quantified by ELISpot (y axis) and CXCL10 mRNA by qTACT (x axis). d, Concordance between ELISpot and dqTACT assays. For 46 participants, IFN-γ producing cells were quantified by ELISpot (y axis) and CXCL10 mRNA by dqTACT (x axis).
