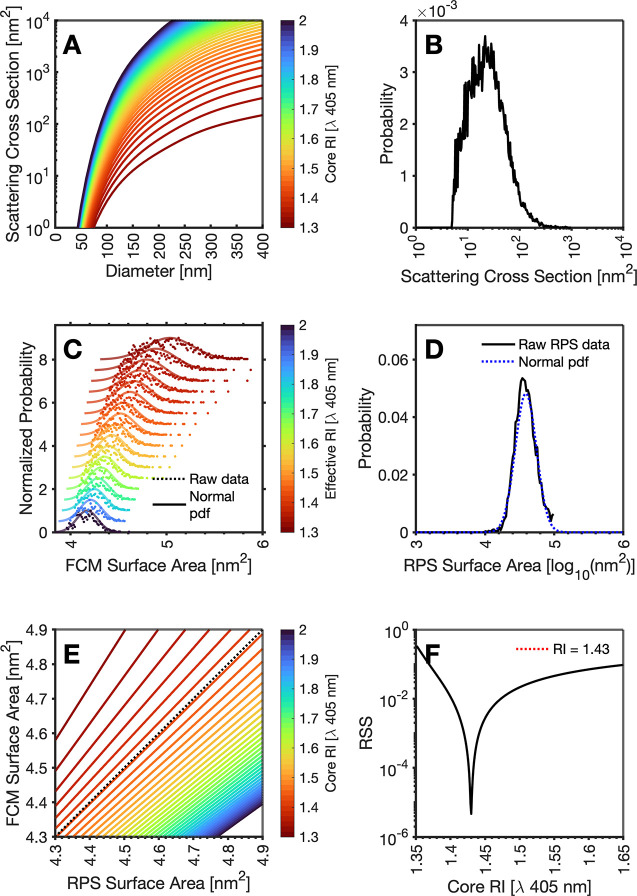
Figure 4.
Overview of rEV RI determination using light scatter FCM with MRPS using core-shell models. (A) Mie models of core RIs from 1.3 to 2. (B) Calibrated FCM light scattering data of rEVs. (C) Representative surface area distribution raw data (dotted line) with normal distribution (solid line) derived from scattering cross section intensity assuming core RIs of 1.3 to 2.0. (D) Surface area distribution of rEVs from MRPS (black solid line) with a fitted lognormal distribution (dotted blue line). (E) Representative 1st to 99th percentile of lognormal surface area distribution derived from scattering cross section intensity assuming core RIs of 1.3 to 2.0 versus 1st to 99th percentile of MRPS surface area normal distribution with ideal regression line overlaid (dotted black line). (F) Residual sum of squares (RSS) from comparison of lognormal surface area distribution derived from scattering cross section intensity assuming RIs of 1.3 to 2.0 versus 1st to 99th percentile of MRPS surface area normal distribution. The lowest RSS is shown with red dotted line. All models assume a core-shell model with an illumination wavelength of 405 nm, a shell RI of 1.4863, a circular collection half-angle of 67.5° perpendicular to the illuminating wavelength, and a surrounding medium RI of 1.343. Core RIs ranged from 1.3 to 2.0 in increments of 0.0005.

