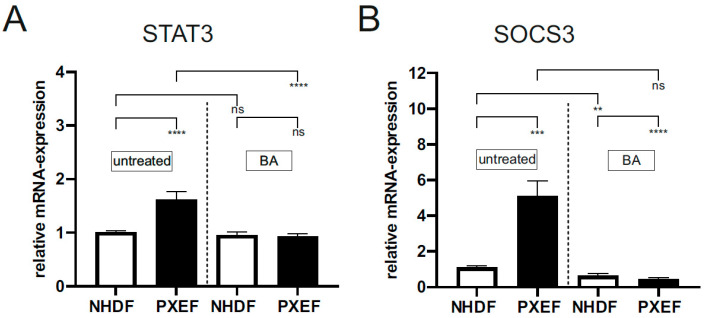
Figure 2.
Relative STAT3 and SOCS3 mRNA expression in PXE and control fibroblasts. Fibroblasts from PXE patients (PXEF) and healthy donors (NHDF) were cultivated for 72 h in 10% LPDS medium with DMSO as a vehicle (untreated) or 1 µM BA. (A) Relative STAT3 mRNA expression of PXEF (black) (n = 4) and NHDF (white) (n = 4). (B) Relative SOCS3 mRNA expression of PXEF (black) (n = 4) and NHDF (white) (n = 4). Data are shown as mean ± SEM. **** p ≤ 0.001, *** p ≤ 0.002, ** p ≤ 0.01, ns p > 0.05.

