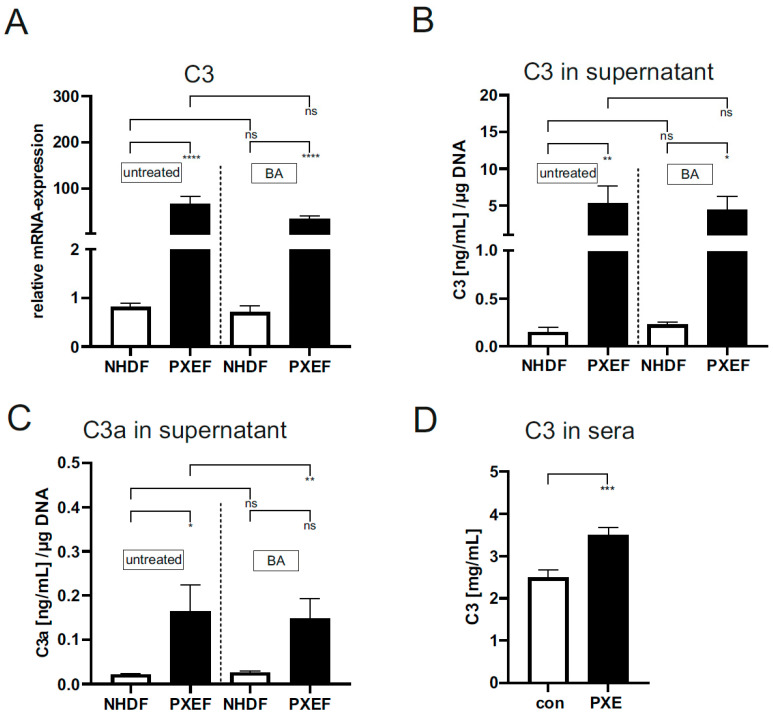
Figure 5.
Relative mRNA expression of C3 and protein concentration of C3 and C3a in supernatants of PXE and control fibroblasts and sera of PXE patients and healthy controls. Fibroblasts from PXE patients (PXEF) and healthy control donors (NHDF) were cultivated for 72 h in 10% LPDS medium with DMSO as vehicle (untreated) or 1 µM BA. The gene expression of (A) C3 and protein level of (B) C3 and (C) C3a in PXEF (black) and NHDF (white). (D) C3 protein concentration in sera from PXE patients (black) (n = 43) and control (white) (n = 41). Data are shown as mean ± SEM. **** p ≤ 0.001, *** p ≤ 0.002, ** p ≤ 0.01, * p ≤ 0.05, ns p > 0.05.

