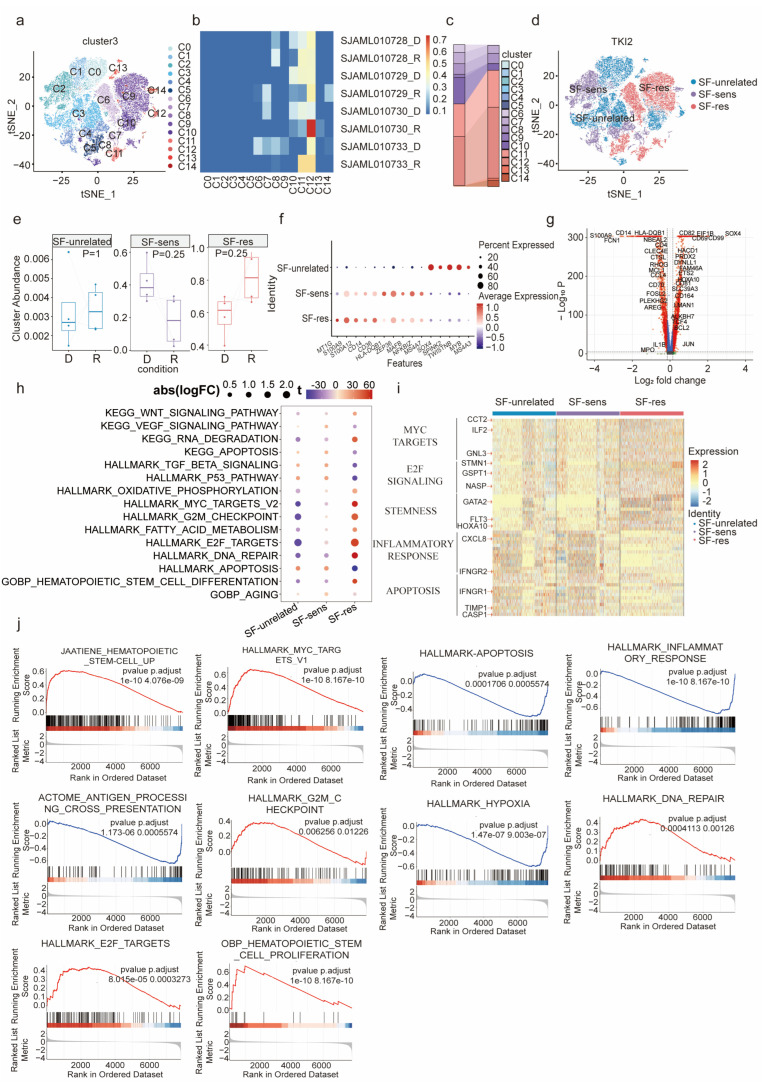
Figure 1.
Characterization of sorafenib-resistant AML cells in scRNA-seq: (a) The tSNE map was generated by analyzing single-cell RNA sequencing data of bone marrow cells of newly diagnosed (D) and relapsed AML patients (R) were analyzed to generate. (b) The distribution of each cluster in 4 pairs of newly diagnosed and relapsed patients. (c) Quantification of each cluster of AML patients at diagnosis and relapse. (d) The distribution of SF-unrelated, SF-sens, SF-res populations in the tSNE map. (e) The abundance of SF-unrelated, SF-sens, and SF-res populations of AML patients at newly diagnosed (D) and relapsed (R). Box plots indicate the range of the central 50% data, with the central line marking the median. Significance was evaluated through a two-sided Wilcoxon rank-sum test. (f) Bubble diagram of differentially expressed genes in SF-unrelated, SF-sens, and SF-res clusters, wherein color and size represent the expression level. (g) Volcano plot of the differential genes between SF-res and SF-sens cluster. (h,i) Gene ontology (GO) analysis (h) and differentially expressed genes (i) in SF-res and SF-sens clusters. (j) Gene set enrichment analysis (GSEA) of hematopoietic stem cell up, MYC-target pathway, apoptosis, inflammatory response, antigen-processing cross-presentation, G2M checkpoint, hypoxia, DNA repair, E2F targets, and hematopoietic stem cell proliferation pathways in SF-res and SF-sens clusters.

