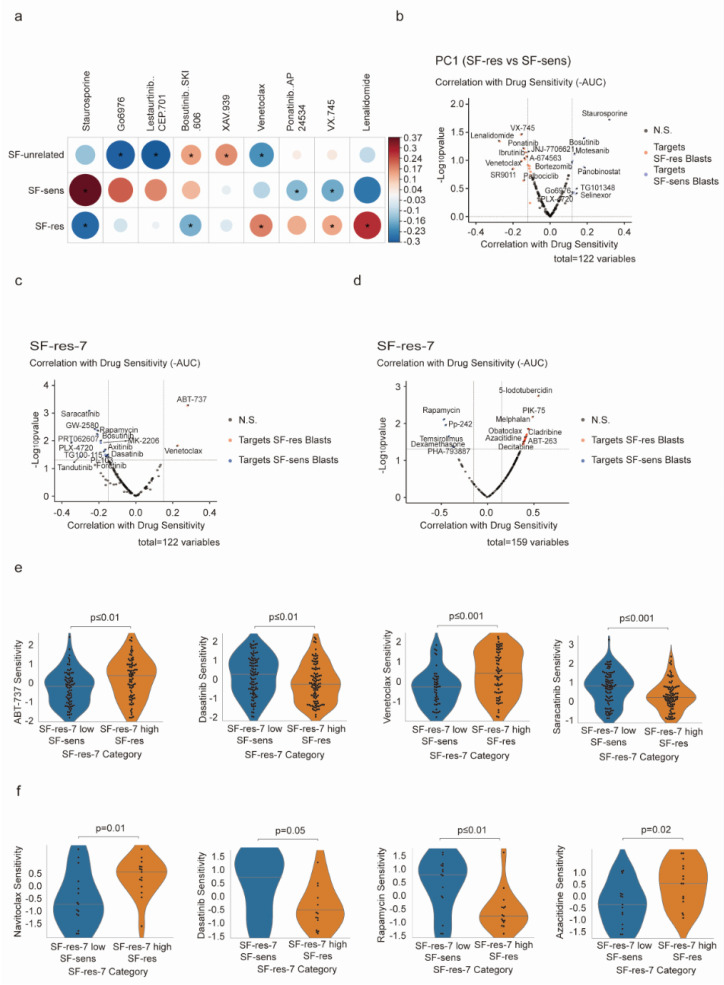
Figure 4.
Drug sensitivity screening of sorafenib-resistant cells: (a) Pearson correlation showing cell type abundance and ex vivo drug sensitivity (-AUC) across 202 diagnostic patient samples in BEAT-AML, wherein color and size represent the direction and magnitude of the correlation. Only correlations with p < 0.05 are presented; those with q < 0.05 are marked with an asterisk. (b) Volcano plot showing correlations between the SF-res versus SF-sens axis (PC1) and ex vivo drug sensitivities from the BEAT-AML screen, identifying drugs that preferentially target either SF-res or SF-sens AML blasts. (c,d) Correlation with SF-res-7 identifies drugs targeting either SF-res blasts or SF-sens blasts from BEAT-AML (c) (Tyner et al.; n = 202) as well as a separate primary AML drug screen (d) (Lee et al.; n = 30). (e,f) Violin chart showing drug resistance scores of SF-res and SF-sens populations with the BEAT-AML database (e) and a separate prediction model of drug sensitivity (Lee et al.) (f).

