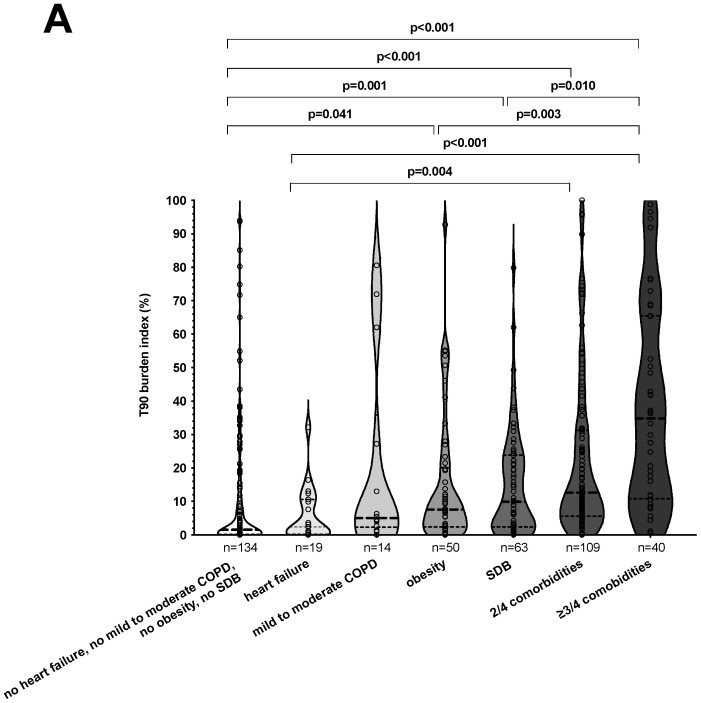
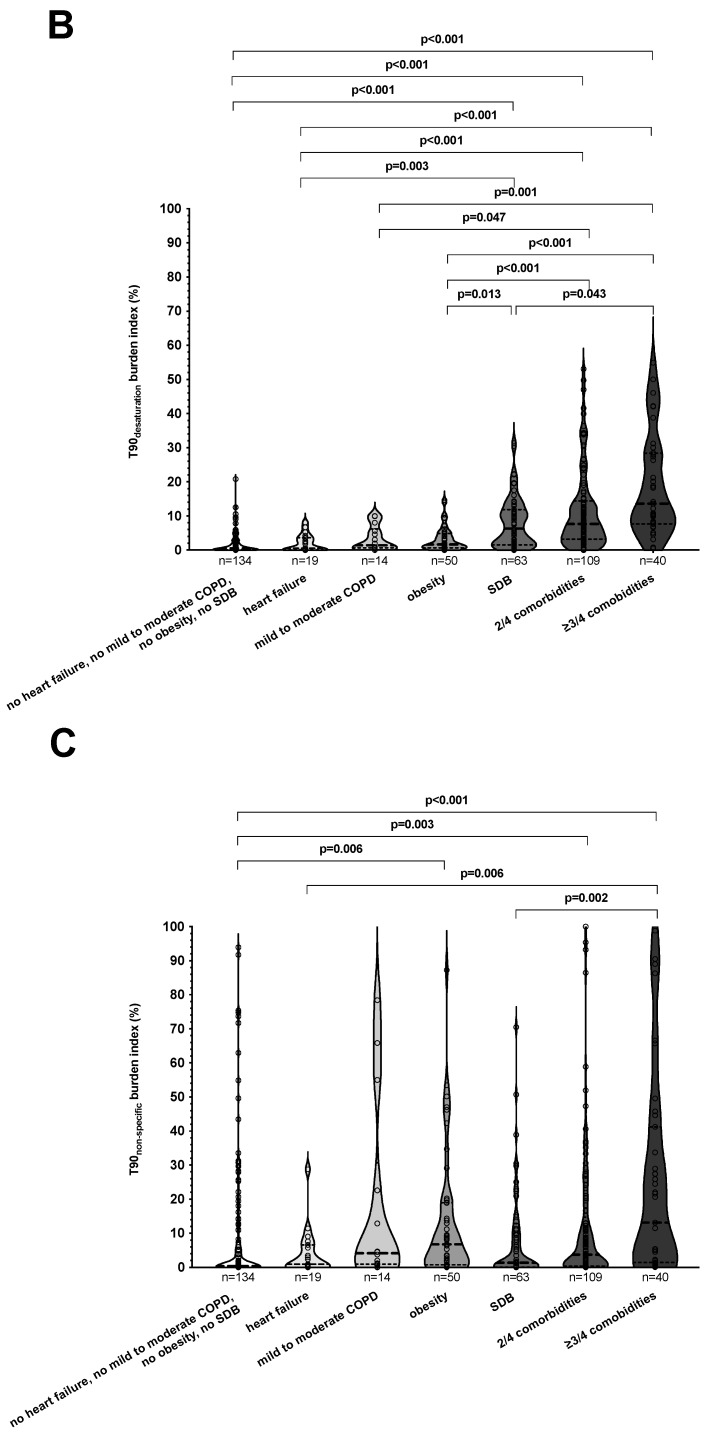
Figure 2.
Nocturnal hypoxemic burden index according to different comorbidities. The violin plots indicate the median and quartiles of the nocturnal hypoxemic burden index in percent of artifact-free total recording time according to different combinations of comorbidities for T90/TRT (A), T90desaturation/TRT (B), and T90non-specific/TRT (C). The violin plot outlines illustrate kernel probability density, i.e., the width of the shaded area represents the proportion of the data. SDB: sleep-disordered breathing; COPD: chronic obstructive pulmonary disease.


