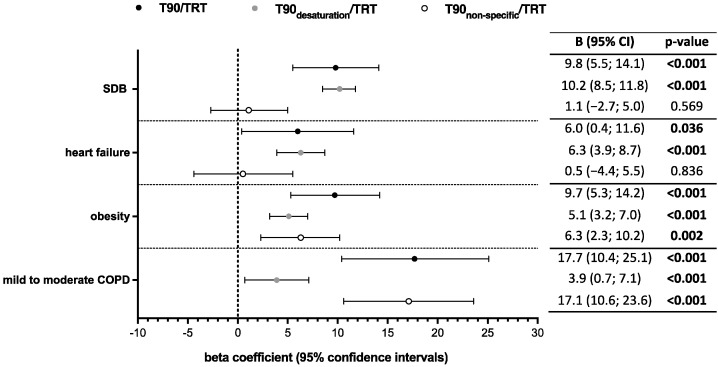
Figure 3.
Association of different comorbidities with an increased nocturnal hypoxemic burden index. Forest plot depicting the association between different comorbidities and metrics of an increased nocturnal hypoxemic burden index (i.e., T90/TRT, T90desaturation/TRT, and T90non-specific/TRT). Values are presented as B: beta coefficient and 95% CI: confidence interval. SDB: sleep-disordered breathing; TRT: artifact-free total recording time; COPD: chronic obstructive pulmonary disease.

