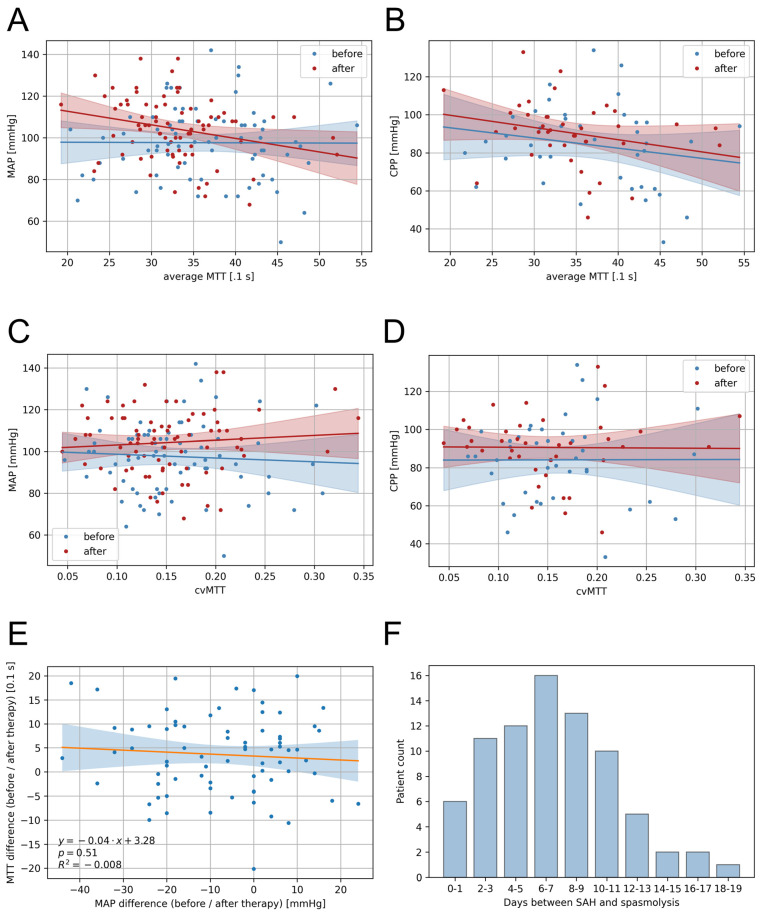
Figure 3.
Correlations of the blood pressure and CT perfusion parameters and presentation of the temporal distribution. (A) The mean MTT showed no significant correlation with the MAP for the first CTP imaging (Dependency MAP ~ MTT CTP1: p = 0.96, R2 = −0.014) but a weak correlation for the second CTP imaging (Dependency MAP ~ MTT CTP2: p = 0.02, R2 = 0.054). (B) The mean MTT showed no significant correlation with the CPP for the first CTP imaging (Dependency CPP ~ MTT CTP1: p = 0.95, R2 = −0.026) and the second CTP imaging (Dependency CPP ~ MTT CTP2: p = 0.13, R2 = 0.035). (C) The cvMTT showed no significant correlation, neither with the MAP (Dependency MAP ~ cvMTT CTP1: p = 0.62, R2 = −0.010; Dependency MAP ~ cvMTT CTP2: p = 0.46, R2 = −0.006) nor (D) the CPP (Dependency CPP ~ cvMTT CTP1: p = 0.99, R2 = −0.026; Dependency CPP ~ cvMTT CTP2: p = 0.95, R2 = −0.026) at the first and the second CTP imaging. (E) Correlation of MTT and MAP differences between the first and the second CTP imaging (linear regression). (F) Number of days between the bleeding event and initiation of multimodal rescue therapy in the patient cohort shown as a bargraph. CPP = cerebral perfusion pressure, cvMTT = coefficient of variation for MTT, MAP = mean arterial pressure, MTT = mean transit time, R = regression coefficient.

