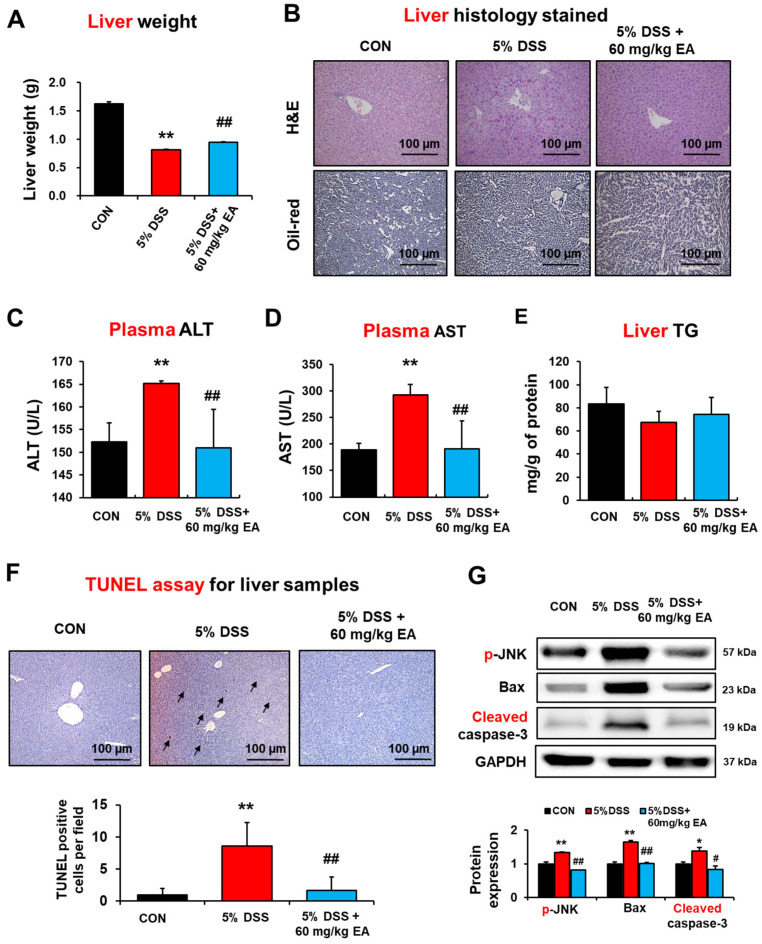
Figure 6.
Effects of EA on liver apoptosis markers proteins of liver in DSS-induced IBD mice. (A) Liver weight changes. (B) Representative H/E-stained formalin-fixed liver sections for CON, DSS, and DSS + EA groups. (C–E) Plasma ALT, AST, and hepatic triglyceride levels in DSS-induced IBD mice. (F) Representative images of TUNEL assay for the indicated groups are presented. Arrows indicate TUNEL positive cells. (G) The levels of apoptosis makers in the indicated groups are presented. Data represent means ± S.E.M. (n = 5–7). The statistical significance between values for each group was assessed by Dunnett’s t-test. * p < 0.05, ** p < 0.01 between 5% DSS and control groups; # p < 0.05, ## p < 0.01 between 5% DSS vs. 60 mg/kg EA groups.

