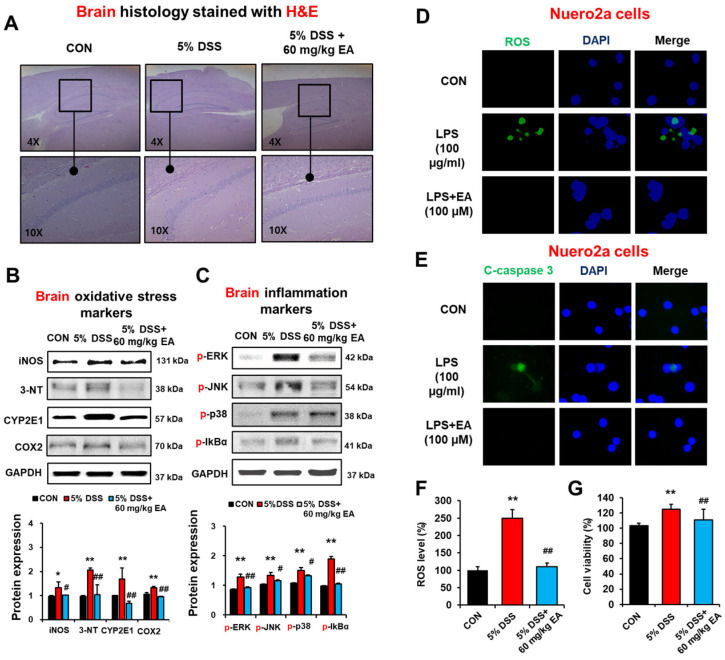
Figure 8.
EA treatment reduced brain marker proteins of oxidative stress and inflammation in DSS-induced IBD mice. (A) Representative H/E-stained formalin-fixed brain sections for CON, DSS, and DSS + EA groups. (B,C) The levels of oxidative stress and inflammatory marker proteins are presented. (D,E) Representative confocal microscopy images of ROS production and cleaved-caspase-3 in neuro-2A cells exposed to the LPS in the absence or presence of EA. Scale bar is 40 μm. (F,G) The levels of ROS and cell viability in Neuro-2A cells exposed to the LPS in the absence or presence of EA. Data represent means ± S.E.M. (n = 5–7/group). The statistical significance between values for each group was assessed by Dunnett’s t-test. * p < 0.05, ** p < 0.01 between 5% DSS and control groups; # p < 0.05, ## p < 0.01 between 5% DSS vs. 60 mg/kg EA groups.

