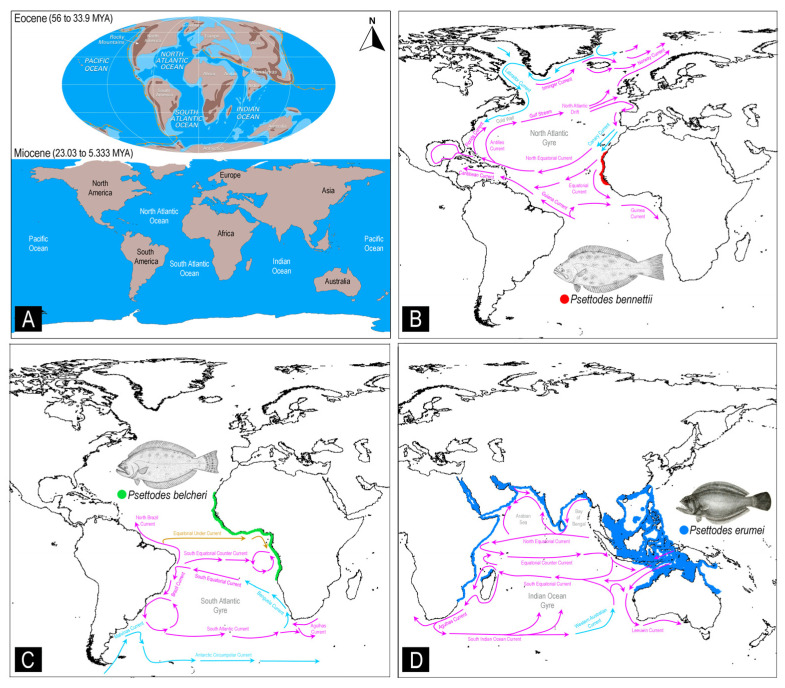
Figure 7.
(A) Maps displaying the maritime environments during the Eocene and Miocene periods (source: Encyclopædia Britannica, Inc.). Schematic representation of the major current systems, as defined by the International Group for Marine Ecological Time Series, in the North Atlantic, South Atlantic, and Indo-West Pacific regions. This section also explores the potential diversification and colonization of primitive flatfishes: (B) P. bennettii, (C) P. belcheri, and (D) P. erumei. The illustration of the Psettodes species was sourced from the free media repository (Wikimedia Commons), as well as a previous study [33]. The maps were generated using the DIVA-GIS platform, utilizing IUCN range distribution data (.shp files). Additionally, the illustration of ocean currents is based on insights from a previous study [94]. Violet arrows indicate the warmer currents, while the blue arrows signify the cooler currents.

