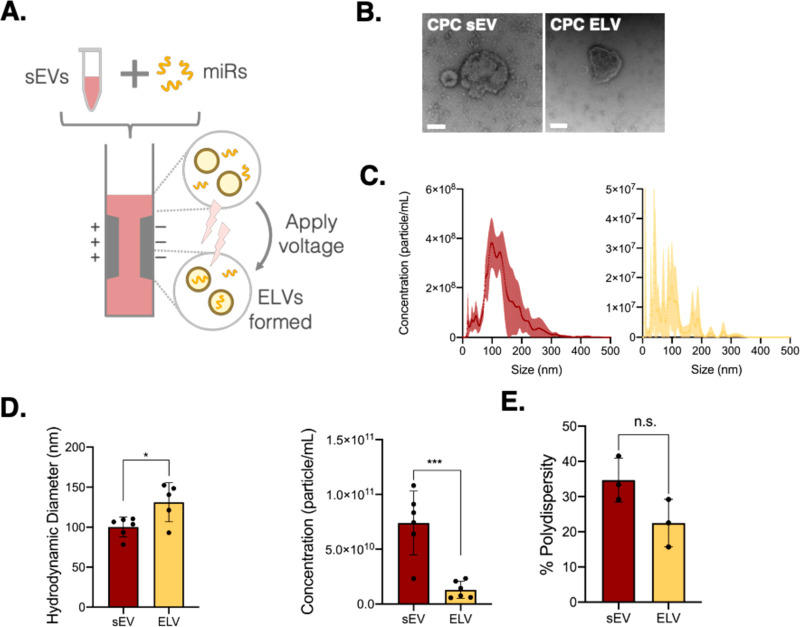
Figure 1.
Synthesis and characterization of ELVs using an electroporation method. (A) Workflow of ELV synthesis from CPC-sEVs by sonication-based cargo removal and electroporation-based miR-126 loading. (B) Transmission electron microscopy images of CPC sEV and electroporation-based CPC ELV. Scale bar = 100 nm. (C) Concentration-size profiles of CPC-sEVs and electroporated ELVs measured with NTA. (D) Comparison of ELV and sEV size and concentration. (E) Comparison of percentage polydispersity index of ELVs and sEVs. Mean ± SEM. Significance was tested with two-way Student’s paired t test. n.s. = not significant. *P < 0.05, ***P < 0.001.

