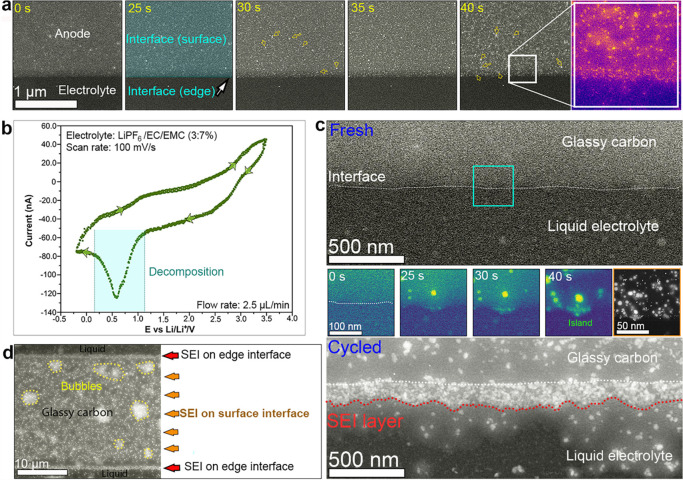
Figure 3.
Time evolution of the GC–electrolyte interface during cycling: (a) time lapse series of ADF-STEM images of the GC-electrolyte interface showing the growth of SEI during cycling; (b) cyclic voltammogram obtained from an operando ec-LC-STEM showing charge–discharge from GC electrode in 1 M LiPF6 /EC/EMC liquid electrolyte at a flow rate of 2.5 μL/min; (c) ADF-STEM images (top, anode–electrolyte interface before cycling; bottom, anode–electrolyte nterface after cycling; middle, time-lapse series of ADF-STEM images of the edge of GC showing the growth of the SEI layer during cycling); (d) ADF-STEM image showing an overview of the GC electrode after a few cycles, where an SEI is clearly visible, and bubbles are formed.

