Figure 1.
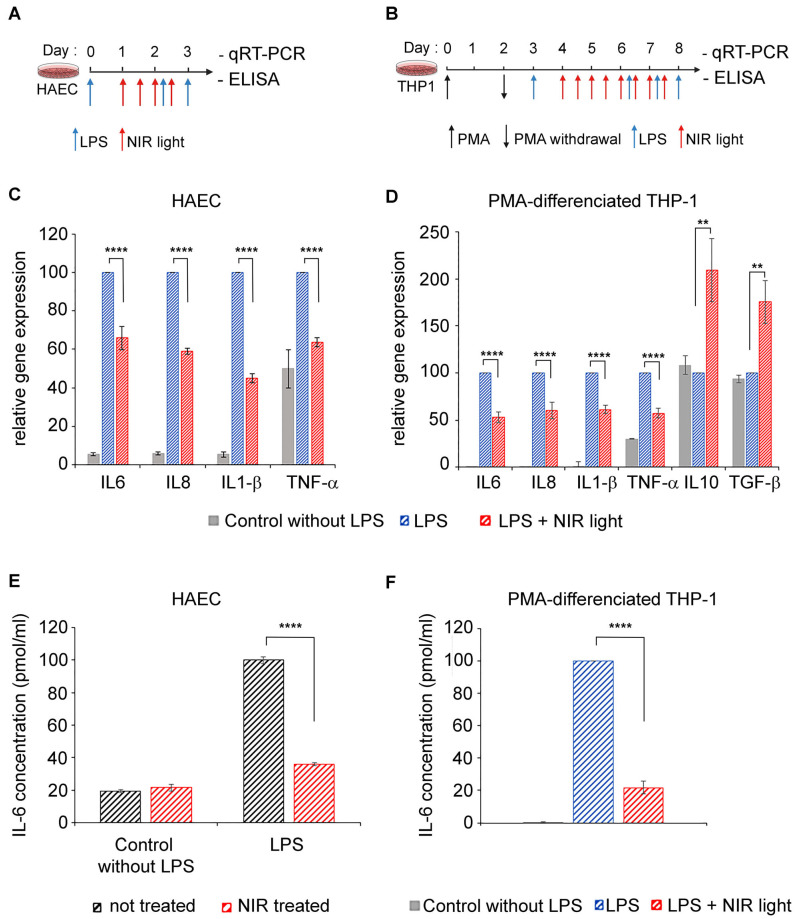
Effect of NIR light treatment on inflammatory cytokine and macrophage polarization. Schematic diagram for LPS-induced activation of TLR4/NF-κB inflammation pathway and NIR light treatment, in (A) HAECs and (B) PMA-differentiated THP-1 macrophage cell line. (A) HAECs were LPS-induced for the inflammatory response and maintained in an inflamed state following two additional LPS boosts (blue arrows), and subjected to brief 10-min intervals of NIR light exposure (red arrows), repeated once every 12 h, over a 48-h trial period. (B) PMA-differentiated THP-1 macrophage cell line was LPS-induced for the inflammatory response and maintained in an inflamed state following three additional LPS boosts (blue arrows) and subjected to brief 10-min intervals of NIR light exposure (red arrows), repeated once every 12 h, over a 96-h trial period. (A,B) Cells cultured without LPS induction were used as controls. For quantification of cytokine gene transcription via qRT-PCR, all cells were harvested 3 h after the last LPS boost. For ELISA quantification of IL6 secretion, cell supernatants were harvested 6 h after the last LPS boost. (C) Gene expression of inflammatory cytokines for HAEC control cells (grey bars) and LPS-induced HAECs with (red bars) or without (blue bars) NIR light treatment. (D) Gene expression of inflammatory and anti-inflammatory cytokines for THP-1 control cells (grey bars) and LPS-induced THP-1 with (red bars) or without (blue bars) NIR light treatment. Measurement of IL-6 protein release via ELISA, from (E) control and LPS-induced HAECs not treated (black bars) or NIR light-treated (red bars) and from (F) THP-1 control cells (grey bars) and LPS-induced THP-1 with (red bars) or without (blue bars) NIR light treatment. For (C,D), n = 4 to 6. For (E,F), n = 3. For (C–F), data are shown as standard error of the mean ± SEM; ** p < 0.01; **** p < 0.0001.

