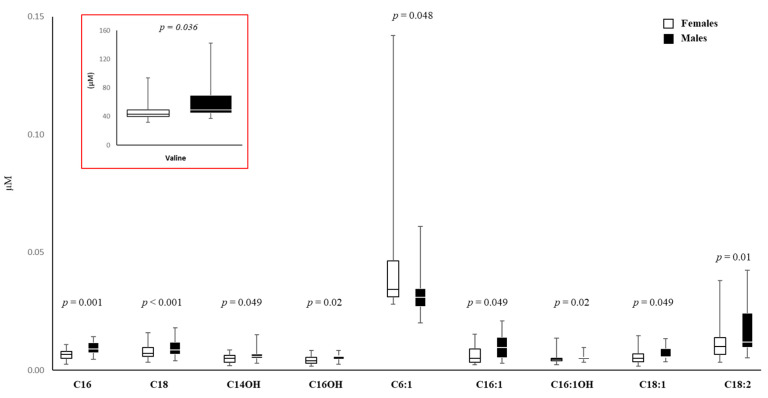
Figure 6.
Box plots of the sex-divergent metabolites in AF from female and male cells. The horizontal line across the box represents the median, and the box comprises the first and the third quartiles. The vertical lines represent the minimum and the maximum values. Sample size for each group is reported in Table S2. The red box represents a reduction of the box plot necessary due to the different scales on the Y-axis.

