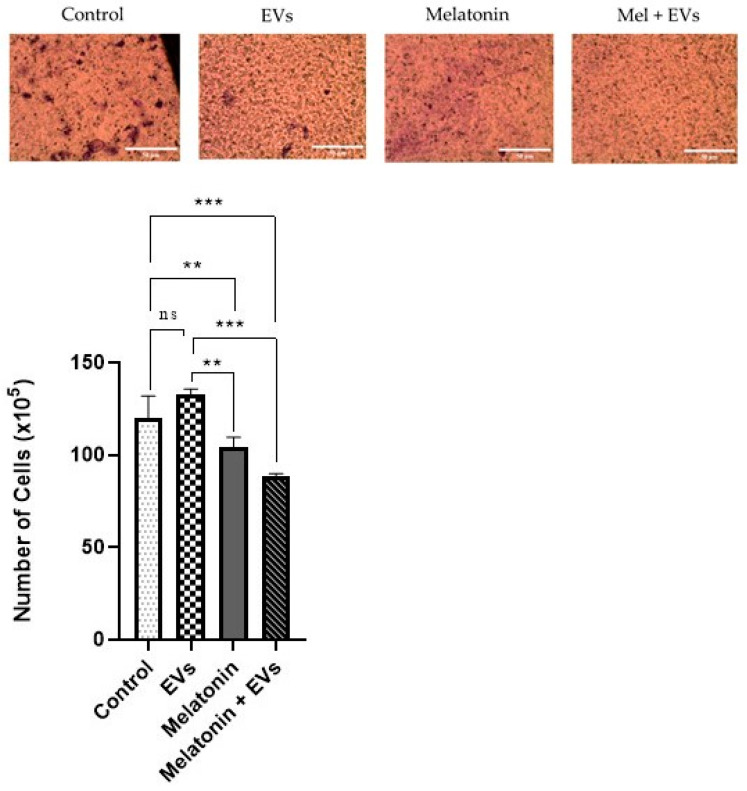
Figure 3.
Cell migration following the combination of melatonin and EVs. The graphs represent the cell migration of the E-20 strain treated with melatonin and EVs for 24 hat a concentration of 1 mM (scale bar: 50 μm). Each column represents the mean + standard error of duplicates. Significant values (** p < 0.01, *** p < 0.001) and nonsignificant values (ns) were obtained using ANOVA followed by Tukey’s test.

