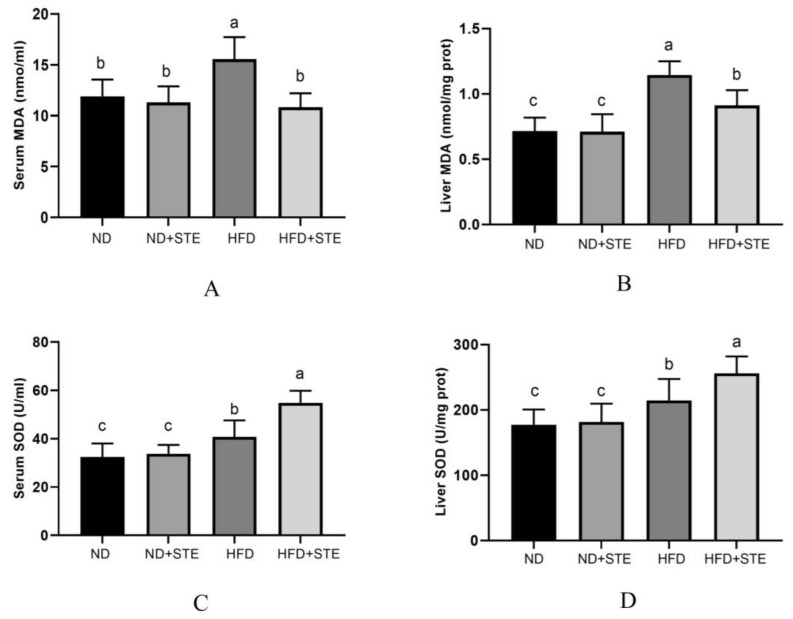
Figure 5.
SOD and MDA levels in the serum and liver of mice. (A) MDA content in the serum of mice; (B) MDA content in the liver of mice; (C) SOD activity in the serum of mice; (D) SOD activity in the liver of mice. Values are expressed as mean ± standard deviation. The same superscript (a, b, or c) in the same column represents no significant differences between values (p > 0.05).

