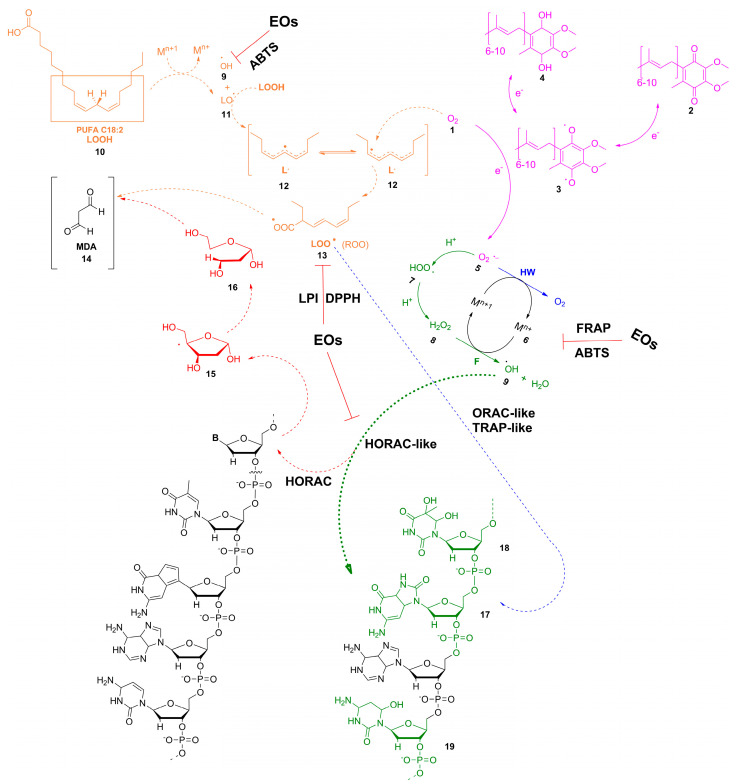
Scheme 1.
The inter-correlation of methods used for monitoring/neutralizing in vitro and in vivo, emphasizing the emergence of ROS by means of the EOs herein. The in vivo emergence of redox-inducing species (pink path, thick arrows): O2, (1), coenzyme Q quinone form (2), coenzyme Q radical form (3), coenzyme Q hydroquinone form (4), O2•− (5); The in vitro assays: FRAP and ABTS assays (green path, thick arrows): Fe2+ ion (6), hydroperoxide radical (HOO•, 7), H2O2 (8), OH• (9); FRAP and ABTS assays (blue path, normal arrow): Fe3+ ion (10); DPPH and LPI assays (orange path, dashed arrows): polyunsaturated fatty acid (10), lipid oxy-radical, L• (11), lipid radical, L• (12), lipid peroxyl-radical, LOO• (13), malondialdehyde (14); HORAC assay (red path, dashed arrows): 2′-deoxyribose radical (15), riboxyradical (16); ORAC- or TRAP-like electrophoretic assay (blue path, dashed arrow): 8-oxoG (17); HORAC-like electrophoretic assay (green path, dashed arrows): 8-oxoG (17), thymineglycol (18), 6-hydroxy-5,6-dihydrocytosine (19).

